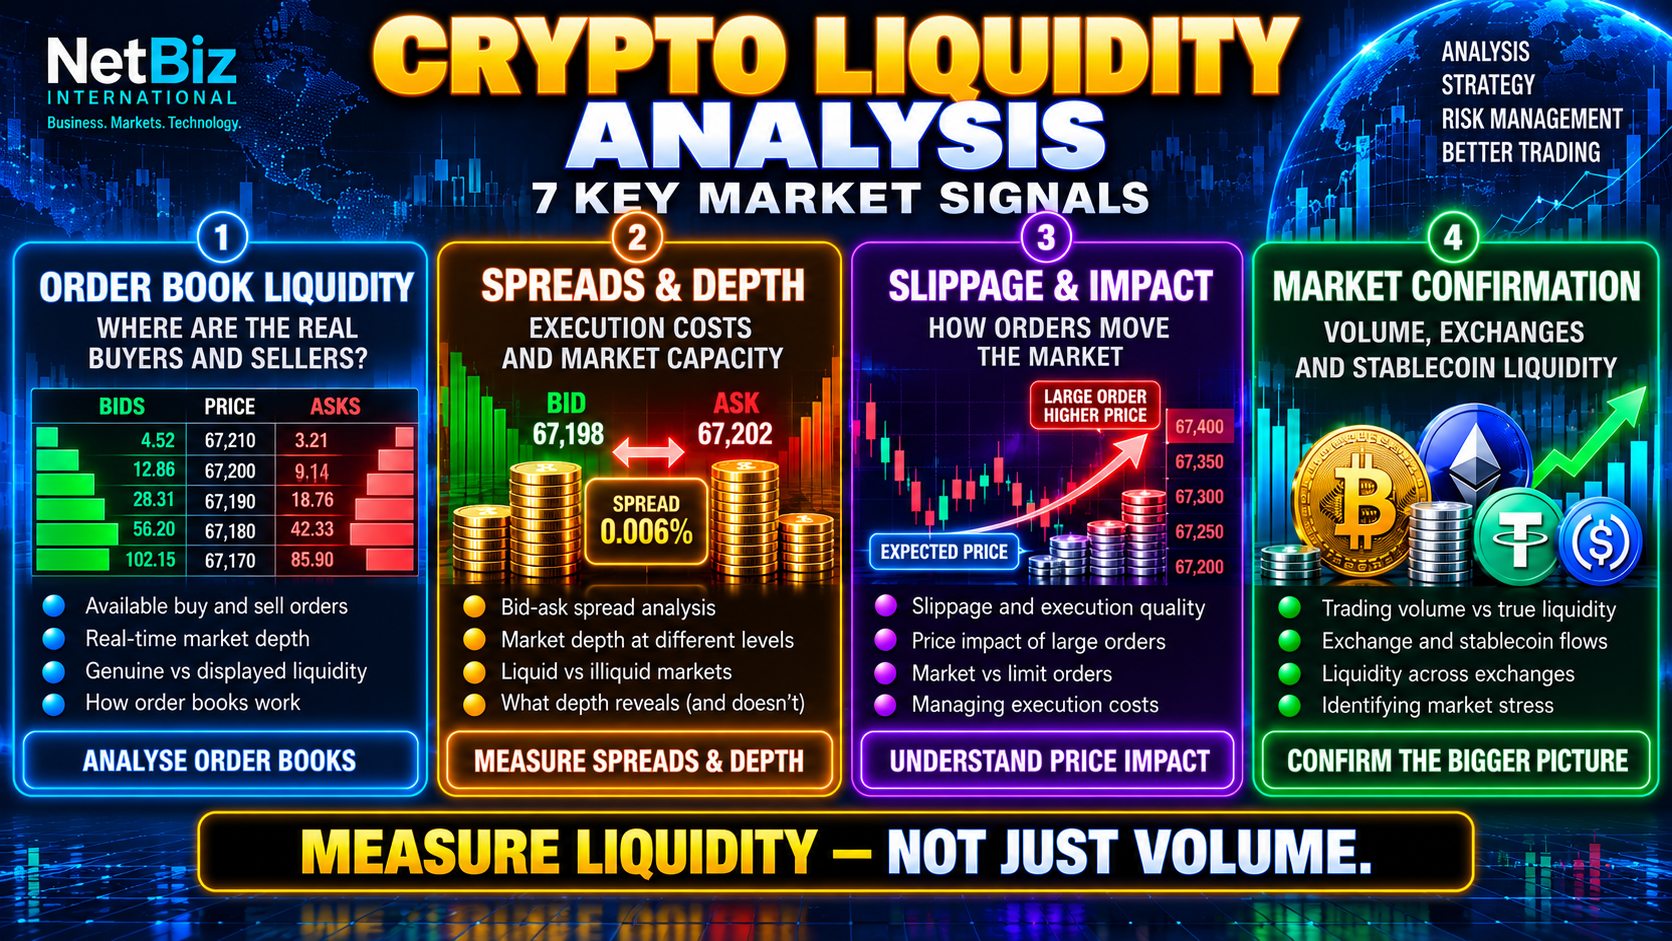
Crypto Liquidity Analysis is an essential part of understanding how cryptocurrency markets function. While price charts and trading volume attract most of the attention, liquidity determines whether buyers and sellers can execute transactions efficiently, how much those transactions cost and how significantly large orders affect market prices.
A cryptocurrency can experience substantial trading activity while remaining difficult to trade in meaningful size. Conversely, an asset with moderate trading volume may have sufficient order-book depth to support efficient execution. These differences matter to individual traders, institutional participants, market makers and anyone assessing the health of digital-asset markets.
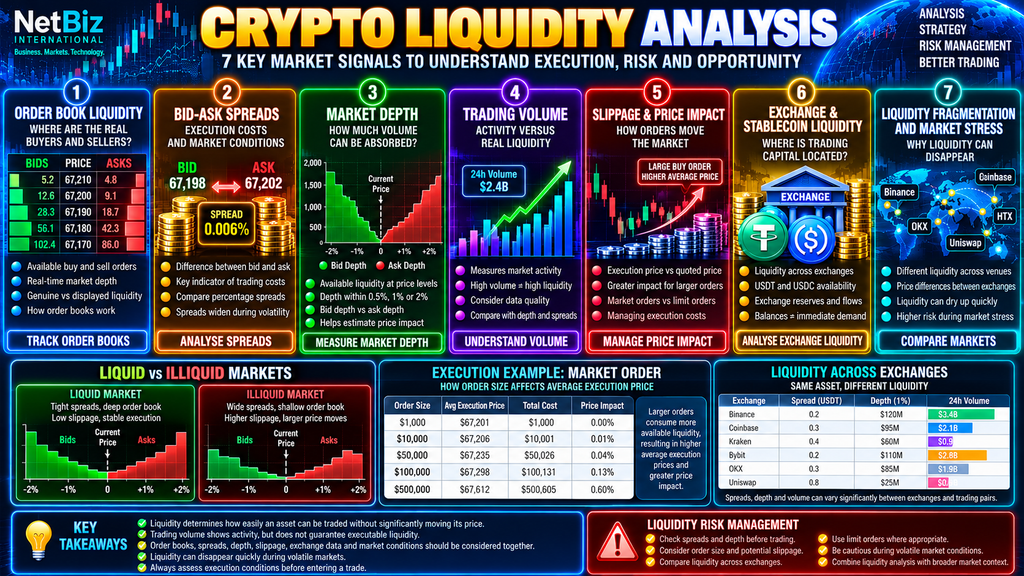
This guide examines seven key market signals: order-book liquidity, bid-ask spreads, market depth, trading volume, slippage and price impact, exchange and stablecoin liquidity, and liquidity fragmentation during market stress.
The central objective is to distinguish apparent market activity from genuinely executable liquidity.
What Is Crypto Liquidity Analysis?
Crypto Liquidity Analysis evaluates how readily cryptocurrencies can be bought or sold at prices close to prevailing market quotations.
In a liquid market, a reasonably sized transaction can usually be completed without causing a substantial price movement. Buyers and sellers are available at multiple price levels, spreads are relatively narrow and order execution is generally efficient.
In an illiquid market, even a modest transaction may consume several available price levels. The resulting execution can occur at a significantly different average price from the quotation displayed before the order was submitted.
Liquidity is therefore closely related to trading costs, price discovery, volatility and market stability.
However, liquidity is not a fixed property of a cryptocurrency. It varies across exchanges, trading pairs, order sizes, market conditions and times of day.
Bitcoin may be relatively liquid on a major exchange in one trading pair while the same asset has considerably less depth on a smaller venue or in a different quotation currency.
Why Crypto Liquidity Analysis Matters
Liquidity affects the practical experience of trading cryptocurrency.
A trader may correctly anticipate a price movement yet achieve a poor outcome because the spread is wide or the execution suffers significant slippage.
Similarly, a trading strategy that performs well in historical price data may fail in live markets if its backtest assumes execution at unrealistic prices.
Liquidity analysis helps answer several important questions:
- How much capital can enter or leave a market without materially affecting price?
- Are buyers and sellers quoting prices close together?
- How much executable volume exists around the current market price?
- Does reported trading volume correspond with meaningful market depth?
- How much slippage could a proposed order experience?
- Is liquidity concentrated on one exchange or distributed across venues?
- How quickly might liquidity deteriorate during market stress?
These questions are relevant to both discretionary and algorithmic trading.
Indicator 1: Order Book Liquidity
An order book displays outstanding buy and sell limit orders for a particular trading pair on an order-book exchange.
Buy orders are commonly called bids, while sell orders are called asks.
The highest available bid and lowest available ask establish the best quoted prices at a particular moment.
Order-book liquidity describes the quantity of orders available for execution across different price levels.
How an Order Book Works
Suppose a cryptocurrency has sell orders at $100.00, $100.10 and $100.25.
A small market buy order may be filled entirely at $100.00.
A larger market buy order may consume all available liquidity at $100.00 before executing against orders at $100.10 and $100.25.
The larger transaction therefore receives a higher average execution price.
This demonstrates why the quoted market price does not guarantee that every unit in a large transaction can be executed at that price.
Visible Liquidity Is Not Guaranteed Liquidity
Order books represent available orders at a particular instant.
Market participants can cancel or modify their orders, and displayed liquidity may disappear as conditions change.
Some execution interest may also remain hidden through specialised order types or institutional execution arrangements.
Consequently, a visible order book provides useful information but not a complete or permanent picture of market liquidity.
Indicator 2: Bid-Ask Spreads
The bid-ask spread is the difference between the highest available bid and the lowest available ask.
It is one of the most accessible indicators of immediate trading costs.
Suppose the best bid is $99.95 and the best ask is $100.05.
The quoted spread is $0.10.
A trader purchasing immediately would generally interact with the ask, while a trader selling immediately would generally interact with the bid.
This creates an immediate execution cost before exchange fees are considered.
Comparing Percentage Spreads
Absolute spreads can be misleading when comparing assets with very different prices.
A useful measure is the spread expressed as a percentage of the midpoint between bid and ask:
Percentage Spread = (Ask − Bid) ÷ Midpoint × 100
where Midpoint = (Ask + Bid) ÷ 2.
A spread of $1 may be negligible for an asset priced at $100,000 but extremely significant for an asset priced at $10.
Percentage spreads therefore provide a more comparable measure across markets.
Why Spreads Widen
Spreads may widen when volatility increases, trading participation declines or liquidity providers become less willing to quote aggressively.
Uncertainty surrounding major economic announcements, exchange disruptions or sudden cryptocurrency price movements can produce these conditions.
A widening spread is not necessarily a directional signal. It may instead indicate that executing transactions has become more expensive.
Indicator 3: Market Depth
Market depth measures the quantity or notional value of orders available within a defined price range around the current market price.
For example, analysts may measure the available bid and ask liquidity within 0.5%, 1% or 2% of the midpoint.
A market with substantial depth can generally absorb larger orders with less immediate price impact than a shallow market, assuming the displayed liquidity remains available.
Bid Depth Versus Ask Depth
Bid depth measures available buying interest below or near the current market price.
Ask depth measures available selling interest above or near the current market price.
An imbalance between these quantities may reveal temporary differences in quoted supply and demand.
However, order-book imbalance should not be interpreted as a guaranteed forecast.
Orders can be cancelled, replaced or strategically displayed, and market orders can change the balance rapidly.
Depth Charts
Many exchanges display cumulative depth charts showing the quantity of available buy and sell orders across price levels.
These visualisations can help traders identify where substantial liquidity is currently quoted.
Nevertheless, large concentrations of displayed orders are not automatically reliable support or resistance levels.
They represent current order placement rather than binding commitments to maintain those orders.
Indicator 4: Trading Volume
Trading volume measures the amount of an asset exchanged during a particular period.
It can be expressed in cryptocurrency units or the value of completed transactions.
Volume is an important market activity indicator, but it should not be confused with market depth.
A market can report substantial volume because participants trade rapidly against a relatively small amount of repeatedly replenished liquidity.
Alternatively, substantial order-book liquidity may be available even during periods of modest completed trading activity.
Volume Versus Liquidity
Consider two hypothetical exchanges.
Exchange A reports $100 million of daily trading volume but has only $200,000 of available liquidity within 1% of the midpoint.
Exchange B reports $40 million of daily volume but has $2 million of liquidity within the same price range.
Exchange A has higher reported activity, while Exchange B currently shows greater quoted depth under the specified measurement.
This does not establish that Exchange B is always better. Order-book resilience, execution speed, fees and reliability also matter.
The example demonstrates why volume alone cannot establish execution quality.
Volume Data Quality
Analysts should also consider how exchanges calculate and report trading volume.
Different data providers may apply different filtering methods, while artificial or non-economic activity can distort reported figures.
Independent confirmation through spreads, depth and actual execution behaviour is therefore valuable.
Indicator 5: Slippage and Price Impact
Slippage occurs when the average execution price differs from the expected or reference price.
For example, a trader may observe a cryptocurrency quoted at $100 but receive an average execution price of $100.40 when submitting a market buy order.
The difference may arise because the order consumes liquidity at multiple price levels or because market quotations change during execution.
Slippage can be favourable or unfavourable, although traders are particularly concerned about adverse slippage.
Price Impact
Price impact refers to the effect a transaction has on market prices.
Larger orders generally require more liquidity and can create greater price impact when market depth is insufficient.
Coinbase Institutional has published research examining the relationship between order size, order-book liquidity and execution costs.
See Coinbase Institutional’s research on market impact and order-book liquidity.
Reducing Execution Costs
Several execution techniques can help manage liquidity-related costs:
- Compare available depth across appropriate trading venues.
- Consider limit orders when price control is important.
- Assess whether a large order should be divided into smaller transactions.
- Avoid assuming that the displayed best price applies to the entire order.
- Account for exchange fees, spreads and estimated slippage.
- Exercise additional caution during rapidly changing market conditions.
These approaches do not eliminate execution risk. Limit orders may remain unfilled, while splitting orders can increase fees, delay execution or expose traders to changing market conditions.
Indicator 6: Exchange and Stablecoin Liquidity
Cryptocurrency liquidity is distributed across centralised exchanges, decentralised exchanges and numerous trading pairs.
Liquidity in BTC/USDT is not necessarily identical to liquidity in BTC/USD or BTC/USDC.
Differences in participants, quotation currencies, exchange infrastructure and market-making arrangements can produce different spreads and depth.
Stablecoin Liquidity
Stablecoins such as USDT and USDC serve as major quotation assets in cryptocurrency markets.
Their availability can influence trading capacity, but stablecoin balances do not automatically represent immediate buying demand.
This distinction was examined in NetBiz’s earlier article on Stablecoin Flows and Market Sentiment.
Stablecoins may be held for payments, collateral, settlement, DeFi activity or defensive positioning.
Consequently, an increase in stablecoin supply does not necessarily mean that order-book depth or executable liquidity has increased on a particular exchange.
Exchange Reserves
Exchange reserve information can provide useful context about assets held within exchange-associated wallets.
However, reserve balances and executable order-book liquidity are different measures.
An exchange may hold substantial Bitcoin reserves without displaying equivalent quantities as active sell orders.
NetBiz has previously examined Bitcoin Exchange Reserves, which provides additional background on this distinction.
Indicator 7: Liquidity Fragmentation and Market Stress
Crypto markets operate across many independent venues.
Unlike a single consolidated order book, liquidity can be fragmented across exchanges, blockchain networks and trading mechanisms.
A trader may find substantial liquidity on one platform and considerably less on another.
Prices can also temporarily diverge between venues when transfers, arbitrage or settlement processes become constrained.
Liquidity Fragmentation
Fragmentation creates additional considerations for traders:
- Different spreads across venues.
- Different available market depth.
- Exchange-specific counterparty and operational risks.
- Transfer and withdrawal restrictions.
- Blockchain transaction fees and confirmation delays.
- Differences in trading-pair availability.
Professional execution systems may use smart order routing to compare available liquidity across multiple venues.
However, access to more exchanges introduces operational, custody and infrastructure considerations.
Liquidity During Market Stress
Liquidity can deteriorate rapidly when volatility rises.
Market makers may reduce quoted size, widen spreads or withdraw orders as uncertainty increases.
Large market orders can then cause disproportionate price movements.
These effects may be amplified by leveraged liquidations, exchange disruptions or concentrated selling.
The Bank for International Settlements’ research on cryptoasset liquidity risks discusses vulnerabilities involving exchange concentration, stablecoin structures and operational disruptions.
Crypto Liquidity Analysis and Market Microstructure
Liquidity is closely connected to market microstructure: the mechanisms through which orders interact, transactions execute and prices emerge.
Order placement, order cancellation, market making and trading venue design all influence execution conditions.
NetBiz’s article on Market Microstructure provides a related perspective on spreads, liquidity and price discovery.
Understanding these mechanisms helps explain why a price chart alone cannot reveal the complete state of a market.
Two identical-looking price patterns may have different execution risks when their underlying liquidity conditions differ.
Centralised Exchanges Versus Decentralised Exchanges
Liquidity analysis also depends on the trading mechanism.
Centralised Order-Book Exchanges
Traditional centralised cryptocurrency exchanges commonly match market orders against outstanding limit orders.
Liquidity can be assessed through quoted spreads, available order-book depth and estimated market-order execution costs.
Decentralised Exchanges and Automated Market Makers
Many decentralised exchanges use automated market makers rather than conventional central limit order books.
In these systems, liquidity is supplied to pools, and smart-contract pricing mechanisms determine swap execution.
For a simple constant-product pool, the relationship between reserves is commonly expressed as:
x × y = k
where x and y represent the quantities of two assets in the pool and k is the constant-product invariant before accounting for fees and changes to liquidity.
As a trade changes the pool’s asset balances, the marginal execution price changes.
Consequently, larger swaps can experience greater price impact, particularly when liquidity is limited or concentrated away from the relevant price range.
Modern decentralised exchange designs can use concentrated liquidity, different invariants or alternative trading mechanisms, so the constant-product model should not be assumed to describe every protocol.
Why Total Value Locked Is Not Enough
Total Value Locked (TVL) is sometimes used as a broad measure of assets deposited into DeFi protocols.
However, TVL is not equivalent to immediately executable trading liquidity.
Assets may be committed to lending, staking or other activities, and concentrated liquidity may be unavailable at the current trading price.
A September 2026 BIS working paper highlights the methodological difficulties involved in converting blockchain data into meaningful economic activity measures.
See BIS research on measuring stablecoin, crypto and DeFi activity.
A Practical Crypto Liquidity Analysis Example
Consider two hypothetical cryptocurrencies, Asset A and Asset B, each quoted at $10.
Asset A has a bid-ask spread of 0.05%, substantial order-book depth and relatively stable quotations.
Asset B has a spread of 0.80%, limited order-book depth and frequent changes in available liquidity.
A trader intends to purchase $25,000 worth of either asset.
Although both cryptocurrencies may appear similarly attractive on a price chart, their execution characteristics are different.
Asset A may absorb the order with relatively limited price impact.
Asset B may require execution across several higher-priced sell orders, producing a less favourable average purchase price.
The difference becomes particularly important if the trader later needs to exit quickly.
Liquidity should therefore be considered before entry rather than only when a position must be closed.
How Liquidity Influences Volatility
Liquidity and volatility are related, but they are not interchangeable.
Volatility measures the extent of price fluctuations.
Liquidity describes the ability to execute transactions without excessive price impact.
Highly volatile markets can remain liquid when substantial two-sided trading interest is available.
Conversely, a market may appear relatively calm until a large order reveals that very little liquidity exists near the quoted price.
Thin markets are especially vulnerable to sudden price movements because comparatively small imbalances can consume available orders.
During stressful conditions, declining liquidity and rising volatility can reinforce one another.
Liquidity and Bitcoin Dominance
Liquidity analysis can also help interpret market leadership.
Bitcoin often attracts significant trading activity and institutional attention, but the liquidity available across individual Bitcoin trading pairs still varies.
During periods of uncertainty, traders may concentrate activity in major assets rather than less-liquid altcoins.
This can be considered alongside Bitcoin Dominance.
However, rising Bitcoin dominance does not automatically prove that Bitcoin liquidity is improving.
Dominance measures Bitcoin’s share of cryptocurrency market capitalisation, not the amount of executable liquidity available in order books.
Liquidity and Altcoin Market Rotation
Altcoin rallies can appear impressive during periods of limited liquidity.
When order books are shallow, relatively small purchases may generate substantial percentage price increases.
That can make isolated price rallies look stronger than the underlying participation supports.
NetBiz’s guide to Altcoin Season Indicators examines market breadth, relative strength and broader participation.
Combining those measures with spreads, depth and price impact can help distinguish sustainable market participation from thin-market price movements.
Nevertheless, liquidity expansion alone cannot establish that an altcoin season has begun.
Advantages of Crypto Liquidity Analysis
Liquidity analysis offers several practical advantages:
- It helps estimate execution costs before orders are placed.
- It distinguishes reported market activity from quoted trading capacity.
- It supports comparisons between exchanges and trading pairs.
- It helps identify fragile conditions during periods of market stress.
- It can improve position sizing and execution planning.
- It provides context for evaluating price breakouts and unusual volatility.
- It supports more realistic algorithmic trading and backtesting assumptions.
These benefits are most useful when liquidity metrics are monitored consistently rather than interpreted from isolated snapshots.
Limitations of Crypto Liquidity Analysis
No single liquidity metric provides a complete picture.
Order Books Change Continuously
Displayed liquidity can be cancelled or modified before an order executes.
Reported Volume May Be Misleading
Volume quality and calculation methods can vary across trading venues.
Exchange Liquidity Is Fragmented
Liquidity available on one venue may not be accessible to a trader using another.
Historical Liquidity Does Not Guarantee Future Liquidity
Market conditions can change abruptly during unexpected events.
On-Chain Metrics Require Interpretation
Wallet transfers, stablecoin balances and DeFi activity do not automatically represent executable trading interest.
Execution Infrastructure Matters
Latency, routing, order types, fees and operational reliability influence realised execution quality.
These limitations make it important to distinguish between observed liquidity, estimated liquidity and liquidity actually achieved through completed trades.
Common Mistakes in Crypto Liquidity Analysis
- Equating trading volume with liquidity. High volume does not guarantee deep order books.
- Ignoring the spread. Trading costs begin before exchange fees are added.
- Assuming the best quoted price applies to the entire order. Large transactions may consume multiple price levels.
- Treating order walls as permanent. Displayed orders can disappear.
- Ignoring differences between exchanges. Liquidity varies by venue and trading pair.
- Confusing stablecoin balances with immediate buying demand. Available capital may remain unused or serve other purposes.
- Using unrealistic backtesting assumptions. Historical candle prices do not guarantee achievable execution.
- Assuming liquidity remains stable during volatility. Depth may deteriorate precisely when it is needed most.
How Crypto Liquidity Analysis Fits Into a Trading Framework
Crypto Liquidity Analysis should be integrated with market structure, technical analysis, execution planning and risk management.
Step 1: Assess the Market
Identify the cryptocurrency, exchange, trading pair and prevailing volatility conditions.
Step 2: Measure the Spread
Compare the bid-ask spread with normal conditions and competing venues.
Step 3: Examine Market Depth
Estimate the available liquidity within a defined percentage of the midpoint.
Step 4: Estimate Order Impact
Assess the likely average execution price for the intended order size.
Step 5: Review Trading Volume
Determine whether market activity supports the observed liquidity conditions.
Step 6: Examine Broader Liquidity Context
Consider stablecoin flows, exchange reserves, fragmentation and relevant market developments.
Step 7: Apply Risk Controls
Use appropriate position sizing, realistic execution assumptions and predefined risk limits.
If liquidity is inadequate for the proposed trade, reducing the order size or remaining out of the market may be preferable.
Crypto Liquidity Analysis for Algorithmic Trading
Algorithmic trading systems require particular attention to liquidity.
A backtest based solely on historical open, high, low and close prices may substantially underestimate live execution costs.
For example, a strategy might identify a profitable breakout entry at $100.00.
In live trading, however, the available ask could already be $100.20, with further slippage occurring as the order executes.
Frequent trading can compound these costs.
A more realistic execution model should consider:
- Expected bid-ask spread.
- Exchange fees.
- Order size relative to available depth.
- Slippage assumptions.
- Execution latency.
- Partial fills.
- Liquidity changes during volatility.
These considerations are especially important for high-frequency, scalping and momentum-based strategies.
A Simple Crypto Liquidity Confirmation Checklist
- Is the bid-ask spread relatively narrow?
- Is sufficient depth available near the current price?
- Can the intended order size be executed without excessive estimated slippage?
- Is trading volume supported by observable market participation?
- Are bid and ask quantities reasonably balanced?
- Are displayed orders remaining available or disappearing rapidly?
- Does another exchange offer materially different execution conditions?
- Are stablecoin and exchange-flow signals consistent with the wider market?
- Is volatility increasing while liquidity deteriorates?
- Have exchange fees and operational risks been considered?
The checklist is not a mechanical buy-or-sell system. Its purpose is to evaluate whether market conditions support efficient execution.
Conclusion: Using Crypto Liquidity Analysis Wisely
Crypto Liquidity Analysis helps explain an important dimension of cryptocurrency trading that price charts and trading-volume figures cannot reveal on their own.
Order-book liquidity, bid-ask spreads, market depth, volume, slippage, exchange liquidity and fragmentation all contribute to the quality of a trading market.
Each indicator answers a different question.
Spreads describe immediate quoted trading costs. Depth measures available orders around the market price. Volume records completed activity. Slippage and price impact describe the practical consequences of execution. Exchange and stablecoin data provide additional context about where assets and trading capital are located.
These indicators are most useful when analysed together, particularly during volatile conditions when apparent liquidity may disappear quickly.
For traders, the objective is not simply to identify where prices might move next. It is also to understand whether a position can be entered, managed and exited efficiently.
The key principle is straightforward: measure executable liquidity, not just market activity.
No responses yet