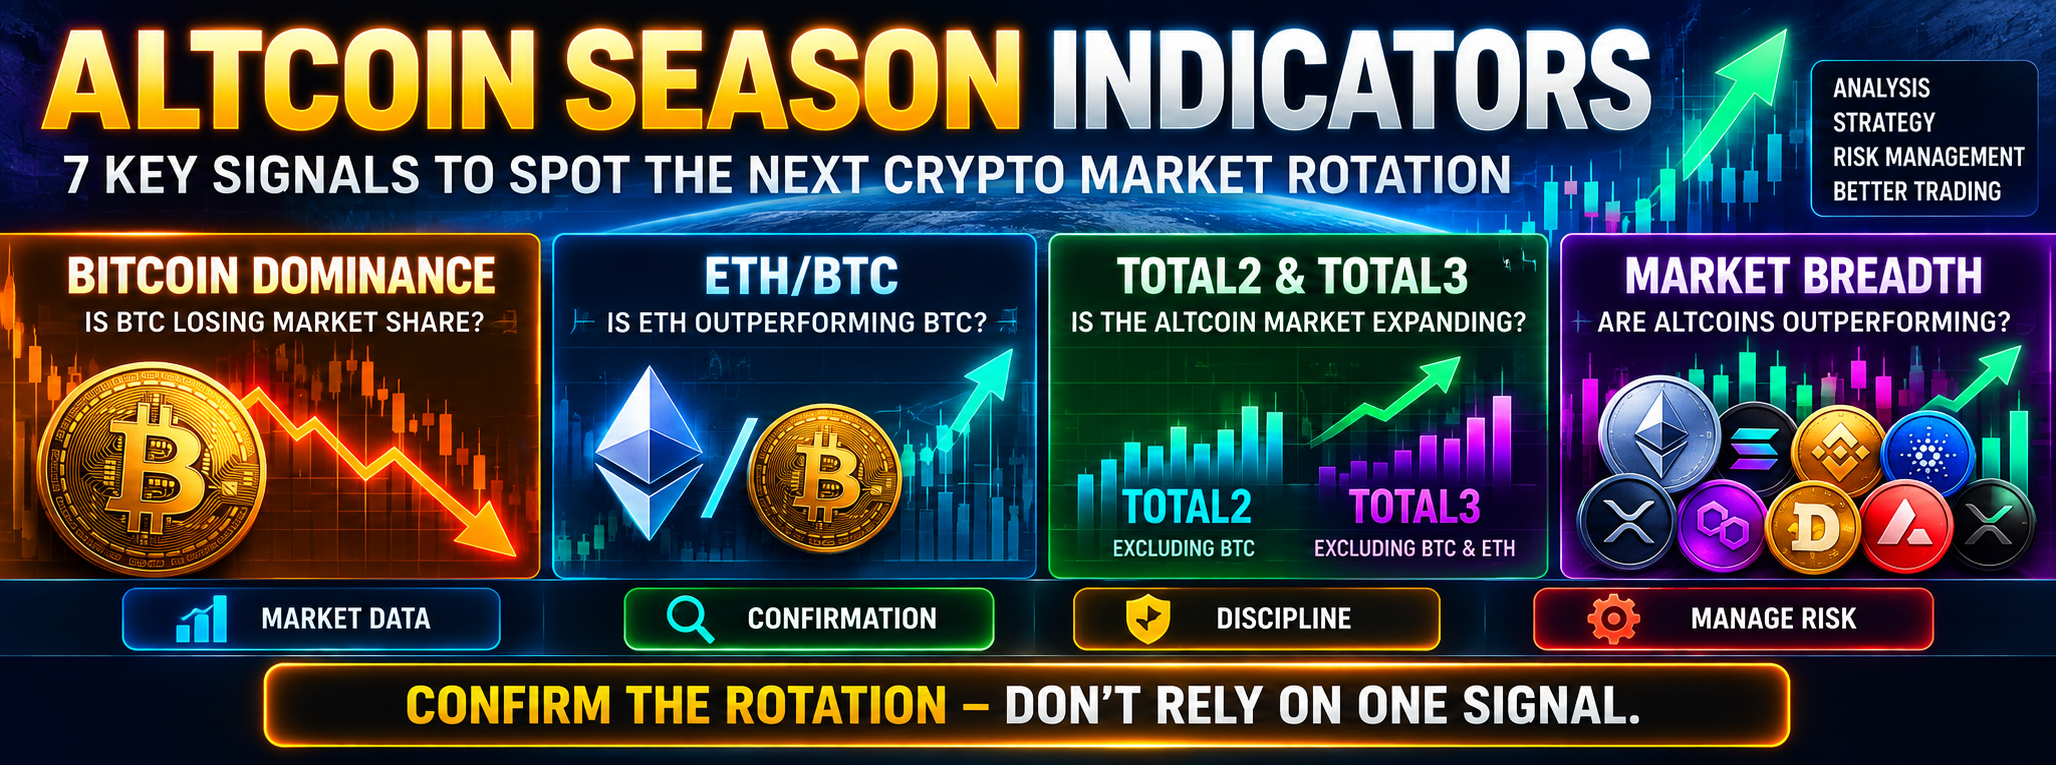
Altcoin Season Indicators help cryptocurrency traders evaluate whether market leadership is broadening from Bitcoin into Ethereum and the wider altcoin market. Rather than assuming that several rapidly rising tokens automatically mean an “altseason” has begun, traders can examine Bitcoin dominance, relative performance, market breadth, ETH/BTC, altcoin market capitalisation, trading volume and liquidity together.
This distinction is important because cryptocurrency markets frequently produce powerful rallies in individual tokens or sectors without developing into a broad altcoin season. A meme-coin rally, an Ethereum rally or strength in several Layer 1 networks can attract attention, but concentrated strength is different from widespread market participation.
The central principle behind Altcoin Season Indicators is therefore confirmation through multiple independent measures.
No single indicator can reliably declare that an altcoin season has started or predict how long one will continue.
What Are Altcoin Season Indicators?
Altcoin Season Indicators are market measures used to evaluate whether cryptocurrencies other than Bitcoin are gaining relative strength and market participation.
They generally attempt to answer several related questions:
- Are altcoins outperforming Bitcoin?
- Is Bitcoin’s share of the cryptocurrency market declining?
- Is capitalisation outside Bitcoin expanding?
- Is Ethereum strengthening relative to Bitcoin?
- Is participation broadening across many cryptocurrencies?
- Are trading volume and liquidity expanding?
- Is strength distributed across several crypto sectors rather than concentrated in a few tokens?
The answers can help distinguish a broad market rotation from an isolated speculative rally.
Why Altcoin Season Indicators Matter
Cryptocurrency market leadership changes over time.
Bitcoin can dominate one stage of a market cycle. Ethereum and large-cap altcoins may strengthen during another stage. Higher-risk mid-cap and small-cap cryptocurrencies can sometimes participate later.
However, this sequence is not a fixed law.
Market structure changes, institutional participation evolves, new cryptocurrency sectors emerge and liquidity conditions vary between cycles. Traders should therefore avoid assuming that every cycle must reproduce the exact sequence observed previously.
Altcoin Season Indicators provide a more systematic way of evaluating what is actually happening.
This connects directly with our guide to Bitcoin Dominance Explained. Bitcoin dominance can provide valuable information about relative market leadership, but it becomes more useful when considered alongside broader measures of altcoin performance.
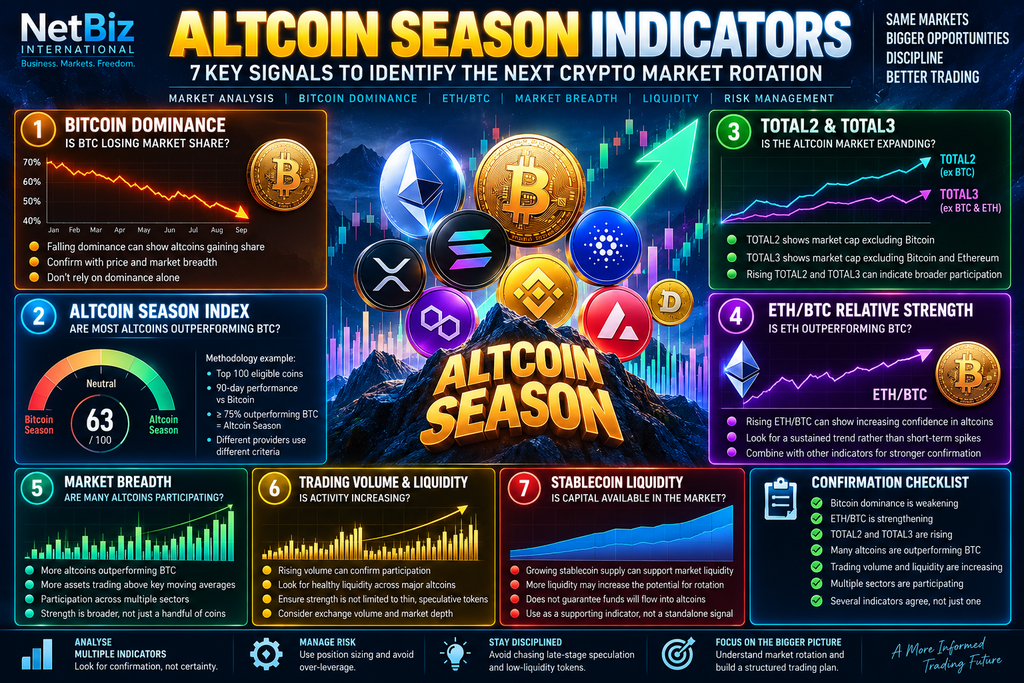
Indicator 1: Bitcoin Dominance
Bitcoin dominance is one of the most widely followed Altcoin Season Indicators.
At its simplest, Bitcoin dominance represents Bitcoin’s market capitalisation as a percentage of the relevant total cryptocurrency market capitalisation.
A simplified expression is:
Bitcoin Dominance = Bitcoin Market Cap ÷ Total Crypto Market Cap × 100
When Bitcoin dominance rises, Bitcoin is gaining market-cap share relative to the broader cryptocurrency universe represented by the calculation.
When Bitcoin dominance falls, non-Bitcoin cryptocurrencies are collectively gaining share.
Why Falling Bitcoin Dominance Can Matter
A sustained decline in Bitcoin dominance during a healthy cryptocurrency market can indicate that participation is broadening.
For example, suppose Bitcoin rises modestly while Ethereum, Solana and a broad collection of other cryptocurrencies rise more rapidly. The market capitalisation of altcoins may expand faster than Bitcoin’s market capitalisation, pushing Bitcoin dominance lower.
That can be consistent with an altcoin-rotation environment.
Why Falling Dominance Is Not Enough
A common mistake is to interpret every decline in Bitcoin dominance as bullish for altcoins.
Consider a different scenario:
- Bitcoin falls 5%.
- Large altcoins fall 10%.
- Smaller altcoins fall 15% or more.
Depending on changes elsewhere in the cryptocurrency universe, dominance measurements can behave in ways that are not captured by a simple “dominance down = altcoins bullish” rule.
The important questions are therefore:
What is Bitcoin doing? What are altcoins doing? Is total market capitalisation expanding? Is participation broad?
Dominance should be interpreted with price and breadth rather than independently.
Indicator 2: Altcoin Season Index
Dedicated Altcoin Season indices attempt to quantify whether a sufficiently large proportion of cryptocurrencies are outperforming Bitcoin.
One widely followed example is CoinMarketCap’s Altcoin Season Index.
CoinMarketCap Altcoin Season Index compares the rolling 90-day performance of the top 100 eligible cryptocurrencies with Bitcoin. Stablecoins and wrapped or asset-backed tokens are excluded under its methodology.
If at least 75% of those eligible cryptocurrencies outperform Bitcoin over the 90-day period, CoinMarketCap classifies the environment as Altcoin Season. If 25% or fewer outperform Bitcoin, it classifies the environment as Bitcoin Season.
Different Providers Can Produce Different Results
An important analytical point is that there is no single universal Altcoin Season Index.
For example, BlockchainCenter also uses a 90-day comparison and a 75% threshold, but evaluates the top 50 eligible cryptocurrencies rather than CoinMarketCap’s top 100 universe.
Consequently, two reputable indices can show different values at the same time without either calculation necessarily being wrong.
The difference may simply reflect methodology.
Before interpreting any Altcoin Season Index, check:
- How many cryptocurrencies are included?
- Which assets are excluded?
- What measurement period is used?
- What threshold defines Altcoin Season?
- How frequently is the index updated?
This prevents traders from treating a provider-specific number as a universal market fact.
Indicator 3: TOTAL2 — Crypto Market Cap Excluding Bitcoin
Market capitalisation outside Bitcoin provides another useful way of examining altcoin strength.
TradingView’s TOTAL2 index represents the combined market capitalisation of its covered cryptocurrency universe excluding Bitcoin.
TradingView TOTAL2 can therefore help traders examine whether the non-Bitcoin portion of the cryptocurrency market is expanding or contracting.
A rising TOTAL2 can indicate that capitalisation is increasing outside Bitcoin.
However, TOTAL2 contains Ethereum. Because Ethereum can represent a substantial proportion of non-Bitcoin cryptocurrency market capitalisation, a strong ETH rally can materially influence the index.
That leads to another useful measure.
Indicator 4: TOTAL3 — Market Cap Excluding Bitcoin and Ethereum
TOTAL3 goes one step further by removing both Bitcoin and Ethereum.
TradingView defines TOTAL3 as the market capitalisation of its covered cryptocurrency universe excluding BTC and ETH.
TradingView TOTAL3 can therefore provide a clearer view of whether participation is spreading into the wider altcoin market beyond the two largest cryptocurrency assets.
This distinction can be particularly useful.
Imagine:
- Bitcoin is flat.
- Ethereum rises strongly.
- Most other altcoins remain weak.
TOTAL2 could look relatively strong because Ethereum is included.
TOTAL3 may reveal that the broader altcoin universe is not participating to the same degree.
If both TOTAL2 and TOTAL3 are rising with healthy market breadth, the evidence of broadening participation becomes stronger.
Indicator 5: ETH/BTC Relative Strength
The ETH/BTC trading pair measures Ethereum’s price relative to Bitcoin.
If ETH/BTC rises, Ethereum is outperforming Bitcoin over that measurement period.
If ETH/BTC falls, Bitcoin is outperforming Ethereum.
Because Ethereum occupies an important position within the cryptocurrency ecosystem, sustained ETH/BTC strength can provide evidence that market leadership is beginning to expand beyond Bitcoin.
But ETH/BTC should not be treated as an altseason switch.
Ethereum can outperform Bitcoin while much of the wider altcoin market remains weak.
For stronger confirmation, ETH/BTC strength can be compared with:
- falling Bitcoin dominance;
- rising TOTAL2;
- rising TOTAL3;
- an improving Altcoin Season Index;
- and broad participation across different cryptocurrency sectors.
Indicator 6: Altcoin Performance Versus Bitcoin
Altcoin season is fundamentally about relative performance.
An altcoin rising in U.S. dollar terms does not necessarily mean it is outperforming Bitcoin.
Suppose:
- Bitcoin rises 30%;
- Altcoin A rises 10%;
- Altcoin B rises 18%;
- Altcoin C rises 25%.
Every asset is positive in dollar terms, but all three altcoins have underperformed Bitcoin.
From a relative-strength perspective, Bitcoin remains the market leader.
This is why BTC-denominated pairs can be informative.
Examples include ETH/BTC and other liquid altcoin/BTC pairs. When a broad range of these pairs begins establishing stronger relative trends, evidence of rotation becomes more convincing.
Indicator 7: Market Breadth
Market breadth addresses one of the most important questions:
How many assets are actually participating?
A broad market advance is different from a rally concentrated in three or four tokens.
Useful breadth observations can include:
- the percentage of major altcoins outperforming Bitcoin;
- the percentage trading above important moving averages;
- the number making new medium-term highs;
- performance across different market-cap groups;
- and participation across different cryptocurrency sectors.
For example, suppose AI-related tokens rally dramatically while DeFi, Layer 1, Layer 2, gaming and infrastructure tokens remain weak.
That may represent a powerful sector rotation, but describing it as a broad altcoin season could be premature.
Breadth helps distinguish the two.
Indicator 8: Trading Volume and Liquidity
Price movement becomes more informative when accompanied by meaningful liquidity and trading activity.
A broad increase in altcoin trading volume can indicate growing participation.
However, volume requires careful interpretation.
High volume can occur during:
- accumulation;
- breakouts;
- speculative rallies;
- liquidations;
- panic selling;
- or distribution.
Volume therefore needs price context.
Liquidity matters as well. Smaller altcoins can produce spectacular percentage gains precisely because their markets are thin. A large percentage move in an illiquid token is not equivalent to broad institutional or market-wide participation.
A healthier altcoin environment generally involves improving liquidity across multiple established assets rather than isolated vertical moves in thin markets.
Indicator 9: Stablecoin Liquidity
Stablecoins form an important part of cryptocurrency market infrastructure because they are widely used as settlement, collateral and trading assets.
Changes in stablecoin supply and exchange availability can therefore provide useful contextual information about crypto-market liquidity.
Increasing stablecoin liquidity can indicate that more crypto-native purchasing capacity is available, but it does not prove that those funds will flow into altcoins.
Stablecoins may remain idle, be deployed into Bitcoin, move into derivatives collateral, enter DeFi protocols or leave exchanges.
For that reason, stablecoin data is best regarded as a liquidity-context indicator rather than direct confirmation of altcoin season.
Indicator 10: Sector Rotation
Altcoins are not a single homogeneous asset class.
The market includes:
- Layer 1 networks;
- Layer 2 networks;
- DeFi protocols;
- AI-related tokens;
- gaming assets;
- exchange tokens;
- meme coins;
- real-world-asset projects;
- privacy-focused assets;
- and many other categories.
Tracking which sectors are strengthening can reveal whether market participation is expanding progressively or remains concentrated around a single narrative.
A potential transition might begin with Bitcoin leadership, followed by stronger Ethereum performance, then expansion into large-cap altcoins and eventually broader participation.
But traders should treat this as a possible market pattern—not a guaranteed sequence.
How Altcoin Season Indicators Work Together
The greatest analytical value comes from combining independent indicators.
| Indicator | Potential Altseason Evidence | Important Limitation |
|---|---|---|
| Bitcoin Dominance | Sustained decline | Does not show whether the whole market is rising |
| Altcoin Season Index | Increasing proportion outperforming BTC | Methodology differs by provider |
| TOTAL2 | Non-BTC market cap rising | Can be heavily influenced by ETH |
| TOTAL3 | Broader ex-BTC/ex-ETH market cap rising | Market-cap growth alone does not measure liquidity quality |
| ETH/BTC | Ethereum outperforming Bitcoin | ETH strength does not guarantee broad altcoin strength |
| Market Breadth | Many assets and sectors participating | Requires a defined asset universe |
| Volume | Participation expanding with price | Volume can also accompany selling or liquidation |
| Stablecoin Liquidity | Potential crypto liquidity expanding | Does not reveal where capital will be deployed |
The framework becomes stronger when several indicators tell a consistent story.
A Practical Altcoin Season Indicators Example
Consider a hypothetical cryptocurrency market.
Bitcoin has already experienced a strong advance and begins consolidating rather than collapsing.
Over the following weeks:
- Bitcoin dominance begins trending lower;
- ETH/BTC establishes a stronger upward structure;
- TOTAL2 breaks above an important resistance area;
- TOTAL3 also strengthens;
- the percentage of major altcoins outperforming Bitcoin increases;
- trading volume expands across several sectors;
- and an Altcoin Season Index moves progressively toward its provider’s altseason threshold.
No individual observation proves that an altcoin season will continue.
Together, however, they provide considerably stronger evidence that cryptocurrency market leadership is broadening.
Now consider the opposite situation.
Bitcoin dominance falls for three days, but TOTAL3 remains weak, ETH/BTC fails to strengthen and only a handful of meme coins rally.
That would be much weaker evidence of a broad altcoin season.
The difference is confirmation and breadth.
Altcoin Season Indicators and Crypto Market Cycles
Altcoin rotation is often discussed as part of the broader cryptocurrency market cycle.
Our guide to Crypto Market Cycles explains why market leadership, liquidity and investor behaviour can change as a cycle develops.
A simplified rotation model sometimes described by traders is:
- Bitcoin attracts initial capital.
- Bitcoin appreciation increases confidence in the crypto market.
- Ethereum and larger altcoins begin gaining relative strength.
- Participation spreads into additional sectors and market-cap groups.
- Speculation eventually becomes increasingly broad.
This model is useful conceptually, but markets do not have to follow it.
Some cycles can remain Bitcoin-dominated for extended periods. Others may feature powerful sector-specific rallies without broad altcoin participation. Structural changes such as ETFs, regulation, institutional adoption and changing token supply can also alter historical relationships.
Advantages and Limitations of Altcoin Season Indicators
Advantages
Altcoin Season Indicators can help traders:
- measure relative performance rather than rely on social-media sentiment;
- distinguish Bitcoin leadership from broader crypto participation;
- identify changes in market breadth;
- compare Ethereum and altcoins with Bitcoin;
- monitor potential capital rotation;
- and build a more systematic market framework.
Limitations
They also have important limitations.
They are generally descriptive rather than predictive. An index can confirm that many altcoins have already outperformed Bitcoin without proving they will continue to do so.
Provider methodologies differ. A top-50 index and top-100 index can generate different readings.
Market capitalisation is not cash flow. An increase in token market cap does not mean an equivalent amount of new money entered the asset.
Low-liquidity assets can distort perception. Large percentage gains can occur without broad sustainable participation.
Altcoins carry substantial individual risks. Tokenomics, smart-contract vulnerabilities, project failure, exchange delisting, regulatory developments and liquidity deterioration can overwhelm broad market conditions.
Risk Management During Altcoin Season
An apparent altcoin season should not be interpreted as permission to abandon risk management.
In fact, rapidly rising altcoin markets can create particularly dangerous conditions because strong recent returns encourage fear of missing out.
Practical risk controls can include:
- limiting position size;
- avoiding excessive leverage;
- checking liquidity before entering smaller assets;
- defining invalidation before entering a trade;
- avoiding concentration in one narrative;
- distinguishing investment exposure from speculative trades;
- and remembering that percentage gains can reverse rapidly.
Traders developing their skills can also use simulated environments before risking significant capital. Our guide to Crypto Trading Practice discusses the value of practising trading decisions before committing real funds.
Common Mistakes When Reading Altcoin Season Indicators
Calling altseason because one coin rallies. Individual strength is not market breadth.
Using Bitcoin dominance alone. Dominance should be compared with Bitcoin price, altcoin market capitalisation and relative performance.
Ignoring ETH/BTC. Dollar prices can hide important changes in relative strength.
Confusing TOTAL2 with the entire altcoin market equally. Large-cap assets can have a disproportionate effect.
Ignoring TOTAL3. Removing both BTC and ETH can provide additional information about broader altcoin participation.
Treating 75 as a magical number. The threshold belongs to particular index methodologies; it is not a universal law of markets.
Ignoring methodology. Different providers use different cryptocurrency universes.
Assuming an indicator predicts the future. Most of these tools describe market conditions that have already developed.
Chasing late-stage speculation. The strongest-looking breadth readings may occur after substantial price appreciation has already taken place.
How Altcoin Season Indicators Fit Into a Trading Framework
Altcoin Season Indicators are most useful as a market-regime framework rather than a standalone entry signal.
A trader could organise the analysis into four layers:
Layer 1: Market Leadership
Evaluate Bitcoin dominance and Bitcoin’s absolute trend.
Layer 2: Relative Strength
Evaluate ETH/BTC and the performance of major altcoins against Bitcoin.
Layer 3: Market Breadth
Examine TOTAL2, TOTAL3, Altcoin Season indices and participation across multiple sectors.
Layer 4: Trade-Specific Analysis
Only after the market regime is understood should the trader analyse the individual asset’s trend, support and resistance, liquidity, volatility and risk-to-reward characteristics.
This distinction matters because a favourable altcoin environment does not make every altcoin a favourable trade.
A Simple Altcoin Season Confirmation Checklist
| Question | Possible Confirmation |
|---|---|
| Is BTC dominance weakening? | Sustained downward trend rather than one-day movement |
| Is ETH gaining against BTC? | ETH/BTC establishing relative strength |
| Is non-BTC market cap expanding? | TOTAL2 strengthening |
| Is broader altcoin market cap expanding? | TOTAL3 strengthening |
| Are many altcoins beating BTC? | Altcoin Season Index rising |
| Is participation broad? | Multiple sectors and market-cap groups strengthening |
| Is liquidity supportive? | Healthy volume and market depth |
The more independent confirmations present, the stronger the evidence of a broad rotation.
That still does not guarantee future returns.
Conclusion: Using Altcoin Season Indicators Wisely
Altcoin Season Indicators provide a structured way to assess whether cryptocurrency market leadership is genuinely expanding beyond Bitcoin.
Bitcoin dominance offers information about relative market share. Altcoin Season indices measure how many eligible cryptocurrencies are outperforming Bitcoin. TOTAL2 and TOTAL3 help assess market-cap growth outside the largest assets. ETH/BTC measures Ethereum’s relative strength, while breadth, volume, liquidity and sector participation provide additional confirmation.
The most important lesson is that no single measure should be treated as definitive.
A falling Bitcoin dominance chart does not automatically mean altseason. A rising Ethereum price does not prove that smaller altcoins are participating. A few spectacular token rallies do not demonstrate broad market strength.
Instead, traders can ask whether several independent indicators are moving in the same direction.
Bitcoin dominance weakening + ETH/BTC strengthening + TOTAL2/TOTAL3 rising + broad altcoin outperformance + expanding participation provides substantially stronger evidence than any one signal alone.
Altcoin Season Indicators are therefore best viewed as a framework for understanding market rotation and relative strength—not as a guaranteed signal to buy altcoins.
Cryptocurrency trading involves substantial risk and high volatility. This material is educational and does not constitute personal financial advice or a recommendation to buy or sell any cryptocurrency.
No responses yet