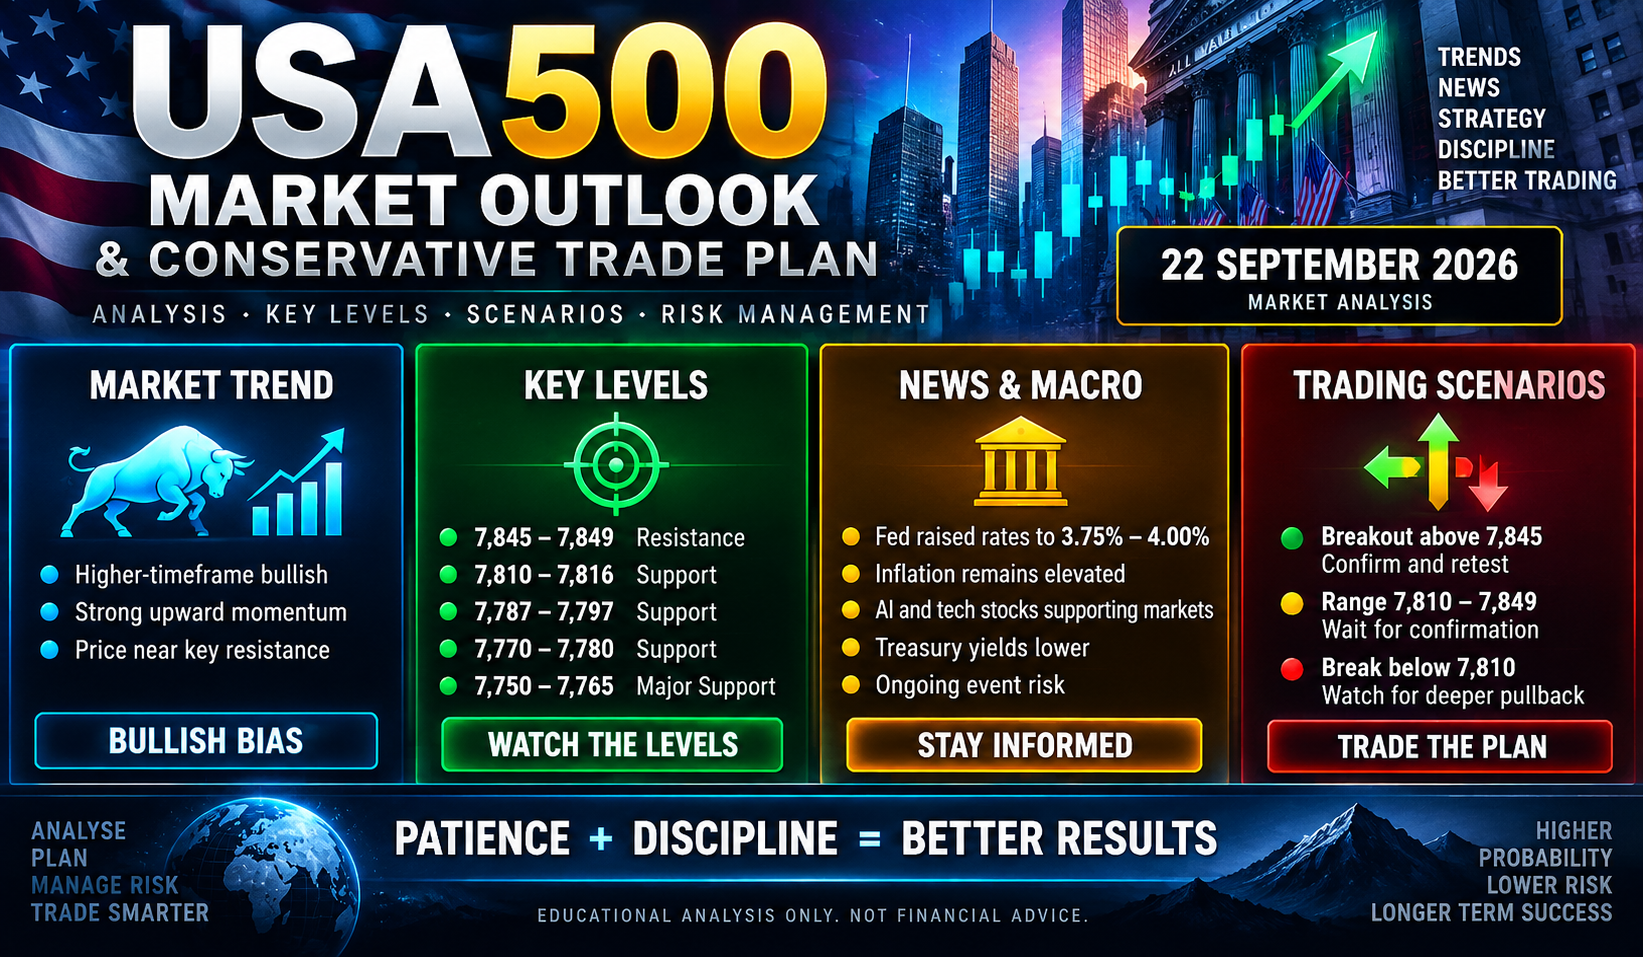
Analysis date: 22 September 2026
This USA500 Market Outlook & Conservative Trade Plan is based on market information available as of 22 September 2026 and the supplied Daily, H1 and M5 charts. Market conditions can change rapidly. The analysis is educational and presents conditional scenarios rather than a prediction or recommendation to buy or sell.
The USA500 Market Outlook currently presents an interesting combination: the higher-timeframe trend remains constructive, short-term momentum is strong, but price has advanced into an important resistance area close to the recent high.
That combination calls for patience.
The Daily chart shows the broader recovery and prevailing bullish structure. The H1 chart shows strong upward momentum. The M5 chart, however, shows price approaching the recent high after an already substantial advance.
For a conservative trader, that distinction matters. A bullish trend does not automatically mean that the current price represents an attractive entry. The objective is to identify where the market is strong, where the analysis becomes invalid, and what price action would provide sufficient confirmation before accepting risk.
USA500 Market Snapshot
- Instrument: US_500 / USA500
- Analysis date: 22 September 2026
- Approximate broker-chart price: 7,836
- Daily trend: Bullish / constructive
- H1 trend: Strong bullish momentum
- M5 condition: Consolidating near recent resistance after a sharp advance
- Immediate resistance: Approximately 7,845–7,849
- Conservative posture: Wait for confirmation rather than chase price
The price levels in this analysis refer to the supplied broker US_500 charts. CFD and broker index quotations can differ from the underlying cash S&P 500 index, so the levels should be interpreted using the same instrument on which the analysis was performed.
Current USA500 News and Macro Backdrop
The fundamental environment remains important because U.S. equities are balancing strong technology and artificial-intelligence enthusiasm against tighter monetary policy and continuing inflation concerns.
The Federal Reserve raised its target range for the federal funds rate by 25 basis points on 16 September 2026, taking it to 3.75%–4.00%. The Federal Reserve said economic activity was expanding at a solid pace, domestic spending had remained resilient, productivity growth was strong and capital investment was robust. At the same time, the Fed stated that inflation remained elevated.
Federal Reserve — September 2026 FOMC Statement
That creates an important tension for equity traders. Strong economic activity and investment can support corporate earnings and equity valuations, but persistent inflation can encourage the Federal Reserve to maintain tighter monetary conditions.
The latest market session also demonstrated the importance of technology and AI sentiment. On 21 September, the S&P 500 gained approximately 1.49%, while semiconductor and AI-related stocks recorded particularly strong gains. Longer-term Treasury yields declined and oil prices also fell, helping improve broader risk sentiment.
The result is a macro environment that can be summarised as:
AI and growth optimism + lower long-term yields and softer oil prices versus inflation risk + tighter Federal Reserve policy.
This is not an environment in which technical analysis should be considered independently from macroeconomic developments. Treasury yields, oil prices, inflation expectations and Federal Reserve communication can all cause rapid changes in equity-index volatility.
Daily Chart: Strategic USA500 Outlook
The Daily chart provides the primary strategic context.
From a higher-timeframe perspective, the USA500 Market Outlook remains constructive while price holds above the major support structure.
The larger structure has remained constructive following the significant March/April 2026 low. The market subsequently recovered strongly, moved through progressively higher trading zones and eventually established the August high.
The correction that followed did not, on the supplied Daily chart, destroy the larger bullish structure. Instead, price recovered and has returned toward the upper portion of the recent range.
This is significant because price is no longer trading near the bottom of the correction. It is approaching the previous high.
The recent Daily Fibonacci structure shown on the supplied chart provides several approximate reference areas:
| Fibonacci Level | Approximate Price Area | Technical Role |
|---|---|---|
| 0% | 7,847 | Recent high / major resistance |
| 23.6% | 7,810 | Shallow retracement support |
| 38.2% | 7,787 | Secondary support |
| 50% | 7,770 | Midpoint of correction |
| 61.8% | 7,751 | Deeper retracement support |
| 100% | Approximately 7,535 | Correction swing-low region |
These figures are approximate visual readings from the supplied chart rather than exported MT5 Fibonacci-object values. They should therefore be treated as zones, not exact turning prices.
The important Daily observation is that price around 7,836 is above the major retracement levels and is now relatively close to the previous high.
That is evidence of strength, but it also means a trader considering a new long position would be entering much closer to resistance than support.
H1 Chart: Strong Momentum but an Extended Location
The H1 chart makes the immediate bullish momentum considerably clearer.
The H1 USA500 Market Outlook therefore remains bullish, although the proximity to resistance makes confirmation particularly important.
From the September 16 region, price established a rising structure before accelerating strongly. The advance moved through the Fibonacci retracement zones and eventually approached the recent high around the 7,845–7,849 region.
The blue moving average is rising and remains below price, reinforcing the short-term bullish structure.
However, trend direction and entry quality are two different questions.
A market can be strongly bullish while simultaneously offering an unattractive risk-to-reward entry at the current price.
Buying immediately underneath established resistance after a substantial upward move can expose a trader to:
- a normal profit-taking pullback;
- a false breakout;
- a liquidity sweep above the previous high;
- an unexpected macroeconomic headline;
- or a deeper correction toward the previous breakout structure.
A more conservative approach is therefore to allow the market to provide additional evidence.
M5 Chart: Execution Context Rather Than Direction
The M5 chart should not determine the strategic market direction. Its purpose is to refine execution after the Daily and H1 charts have established the broader context.
The supplied M5 chart shows a powerful intraday advance from approximately the 7,720 region toward 7,845. Price then pulled back from the high before recovering toward approximately 7,836.
That creates a clear short-term technical question:
Can buyers establish acceptance above the recent high, or will the resistance area produce another rejection?
For conservative execution, simply seeing a five-minute candle trade above resistance is not necessarily sufficient.
A stronger sequence would be:
Breakout → Hold → Retest → Renewed buying.
This reduces the temptation to chase an extended candle and provides a clearer technical point at which the trade premise would become invalid.
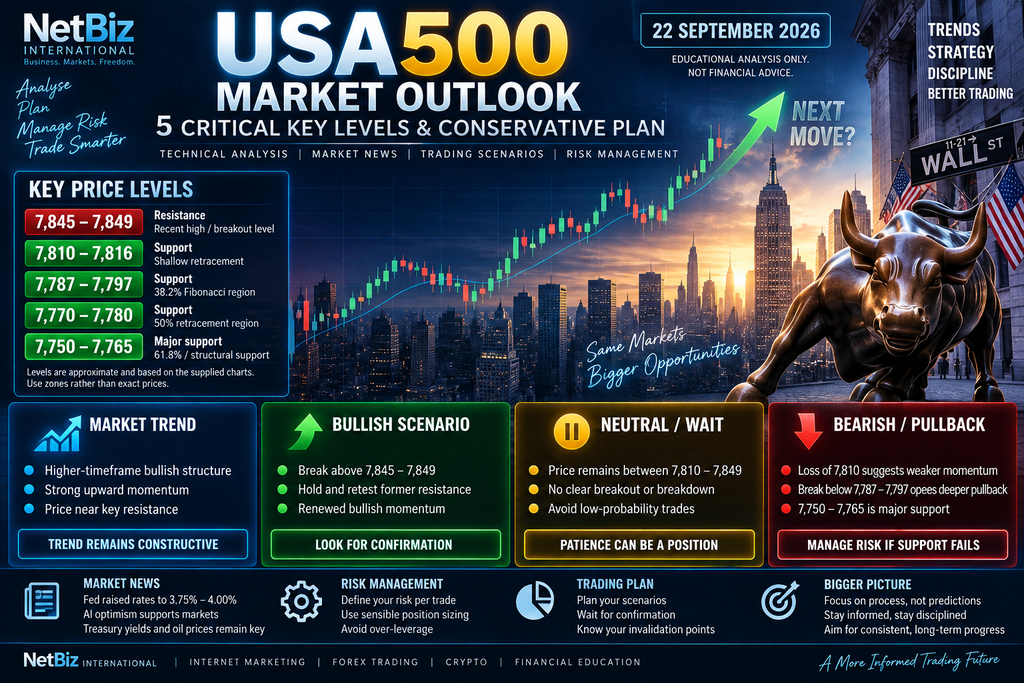
Key USA500 Technical Levels
| Approximate Level | Type | Timeframe | Why It Matters |
|---|---|---|---|
| 7,845–7,849 | Resistance | D1 / H1 / M5 | Recent high and immediate breakout area |
| 7,835–7,836 | Current area | M5 | Approximate price shown on supplied charts |
| 7,810–7,816 | Initial support | D1 / H1 | Shallow Fibonacci / previous breakout region |
| 7,787–7,797 | Secondary support | D1 / H1 | 38.2% region |
| 7,770–7,780 | Support | D1 / H1 | Approximate 50% retracement region |
| 7,750–7,765 | Major support | D1 / H1 | Deeper Fibonacci and structural support region |
| Approximately 7,535 | Major structural support | D1 | Recent correction swing-low region |
Support and resistance should be treated as areas rather than precise numbers. Markets frequently penetrate technical levels before reversing, particularly during periods of high volatility.
Bullish USA500 Scenario
The USA500 Market Outlook becomes more strongly bullish if price establishes acceptance above the recent high rather than merely trading through it temporarily.
The bullish continuation case becomes stronger if price decisively breaks the approximately 7,845–7,849 resistance zone and demonstrates acceptance above it.
A conservative trader may prefer not to buy the initial breakout candle. Instead, the market could be allowed to establish the breakout first.
A subsequent pullback toward the broken resistance zone would then become important.
If former resistance begins behaving as support and bullish price structure reappears, the breakout would have stronger technical confirmation.
The sequence would therefore be:
- Price breaks above 7,845–7,849.
- Price holds above the breakout region.
- A pullback tests the former resistance.
- The area holds as support.
- Short-term bullish structure resumes.
This does not guarantee continuation, but it provides considerably more information than entering before the breakout occurs.
Neutral USA500 Scenario: Wait
The neutral scenario is particularly important for a conservative trading framework.
Price could remain between approximately 7,810 and 7,849 without producing either a convincing breakout or a meaningful structural failure.
In that situation, repeated movement underneath resistance could simply represent consolidation.
The appropriate response does not have to be a trade.
No trade is a valid market position.
Waiting can avoid unnecessary exposure to whipsaw, false breakouts and poor risk-to-reward conditions.
Bearish or Deeper Pullback Scenario
A rejection from the recent high would not by itself establish a major bearish trend. Markets routinely retrace during otherwise healthy advances.
The bearish interpretation should therefore strengthen progressively as support levels fail.
A move below approximately 7,810–7,816 would be the first warning that immediate breakout momentum was weakening.
A sustained move through approximately 7,787–7,797 would indicate a deeper retracement and could bring the 7,770–7,780 region into focus.
A failure of the approximately 7,750–7,765 structural support zone would be considerably more important. At that stage, the H1 bullish structure would require reassessment.
Even then, a short-term H1 reversal should not automatically be described as a complete Daily bear market. Different timeframes can simultaneously display different market structures.
Conservative USA500 Trade Plan
| Scenario | Trigger | Conservative Approach | Invalidation Concept | Main Risk |
|---|---|---|---|---|
| Bullish breakout | Confirmed break above 7,845–7,849 | Wait for hold/retest rather than chase | Failed breakout and return below structure | False breakout |
| Bullish pullback | Retracement into established support | Wait for bullish confirmation | Structural support fails | Correction extends |
| Range | Price remains between support and resistance | No trade / wait | Not applicable | Whipsaw |
| Bearish structure | Important support fails and retest rejects | Require structural confirmation before considering bearish exposure | Recovery above failed level | Entering against larger Daily trend too early |
Conservative Risk Management
Risk management should determine position size rather than confidence in a forecast.
The USA500 Market Outlook should always be considered alongside position sizing, volatility and scheduled economic-event risk.
For an educational conservative framework, a trader might define a maximum account risk of approximately 0.25%–0.50% per trade. The exact percentage depends on the trader’s circumstances, strategy, volatility tolerance and established trading plan.
For example, on a hypothetical $20,000 account:
- 0.25% risk represents $50;
- 0.50% risk represents $100;
- 1.00% risk represents $200.
The technical invalidation point should determine the stop distance. Position size can then be calculated backwards from the maximum permitted account risk.
This is preferable to selecting a large position first and then forcing an artificially tight stop simply to make the monetary risk fit.
Additional conservative principles include:
- Do not chase unusually extended candles.
- Do not assume every breakout will continue.
- Reduce exposure around major scheduled economic events where appropriate.
- Do not widen a stop merely because price is approaching it.
- Avoid excessive leverage.
- Require stronger evidence for countertrend trades.
- Accept that missing a trade is preferable to taking a poor-quality setup.
What Would Change the USA500 Outlook?
A useful market outlook should explain what would make its current interpretation wrong.
At present, the technical picture is constructive, but the evidence would change progressively.
A rejection around 7,845–7,849 would confirm resistance but would not automatically indicate a major reversal.
A break below approximately 7,810 would suggest that immediate upward momentum was weakening.
A move below the 7,787–7,797 area would indicate a deeper correction.
A sustained failure around 7,750–7,765 would materially weaken the immediate H1 bullish structure.
A much larger structural deterioration would be necessary before concluding from the supplied Daily chart that the entire higher-timeframe advance had reversed.
This multi-timeframe distinction prevents a common analytical mistake: interpreting every short-term bearish candle as a higher-timeframe trend reversal.
Fundamental Risks to Watch
Federal Reserve policy: The September rate increase means interest-rate expectations remain important. Changes in expectations for further tightening can quickly affect Treasury yields and equity valuations.
Inflation: Persistent inflation could strengthen expectations for additional monetary tightening. Conversely, convincing evidence that inflation pressure is easing could reduce rate concerns.
Treasury yields: Higher long-term yields can pressure equity valuations, particularly growth and technology shares. Falling yields can provide the opposite effect.
AI and semiconductor sentiment: Recent market strength has been materially influenced by renewed enthusiasm surrounding AI investment and semiconductor companies. A reversal in that sentiment could therefore affect the broader index.
Oil and geopolitical risk: Energy prices remain relevant because rising oil can increase inflation concerns. Falling oil can relieve some of that pressure.
These variables should be monitored alongside the chart rather than treated as separate subjects.
USA500 Market Outlook: Bottom Line
The USA500 Market Outlook remains technically constructive across the supplied Daily and H1 charts, while the M5 chart shows price trading close to important resistance following a substantial advance.
The principal technical battle is around approximately 7,845–7,849.
A confirmed breakout, acceptance above that region and successful retest would strengthen the bullish continuation case.
A controlled pullback into established support followed by renewed bullish structure could provide another form of confirmation.
Conversely, repeated rejection followed by successive failures of the 7,810, 7,790 and deeper support regions would progressively strengthen the corrective scenario.
The fundamental backdrop remains mixed. AI and technology optimism, lower long-term yields and softer oil prices have recently supported equities, while persistent inflation and tighter Federal Reserve policy remain important risks.
Any change in the USA500 Market Outlook should be based on new technical or fundamental evidence rather than short-term market noise.
For a conservative approach, the conclusion is therefore straightforward:
Trend: Bullish.
Momentum: Strong.
Location: Near major resistance.
Macro environment: Mixed.
Conservative posture: Wait for breakout/retest or pullback confirmation rather than chasing an extended market.
If neither bullish nor bearish confirmation develops clearly, the appropriate position may simply be:
WAIT / NO TRADE.
Educational market analysis only. It does not constitute personal financial advice or a recommendation to enter a particular trade. Leveraged products can produce substantial losses, and market conditions can change rapidly.
No responses yet