INTRODUCTION
Cryptocurrency markets are famous for dramatic price movements.
Bitcoin and other digital assets can experience extraordinary periods of appreciation, followed by severe corrections and prolonged periods of declining prices. Investor sentiment can shift from extreme pessimism to extraordinary optimism before reversing again.
These movements may initially appear chaotic.
However, when cryptocurrency markets are examined over longer periods, recognizable phases begin to emerge.
These phases are commonly described as crypto market cycles.
A market cycle represents the progression of a market through different stages of investor participation, liquidity, sentiment, valuation, and price behavior.
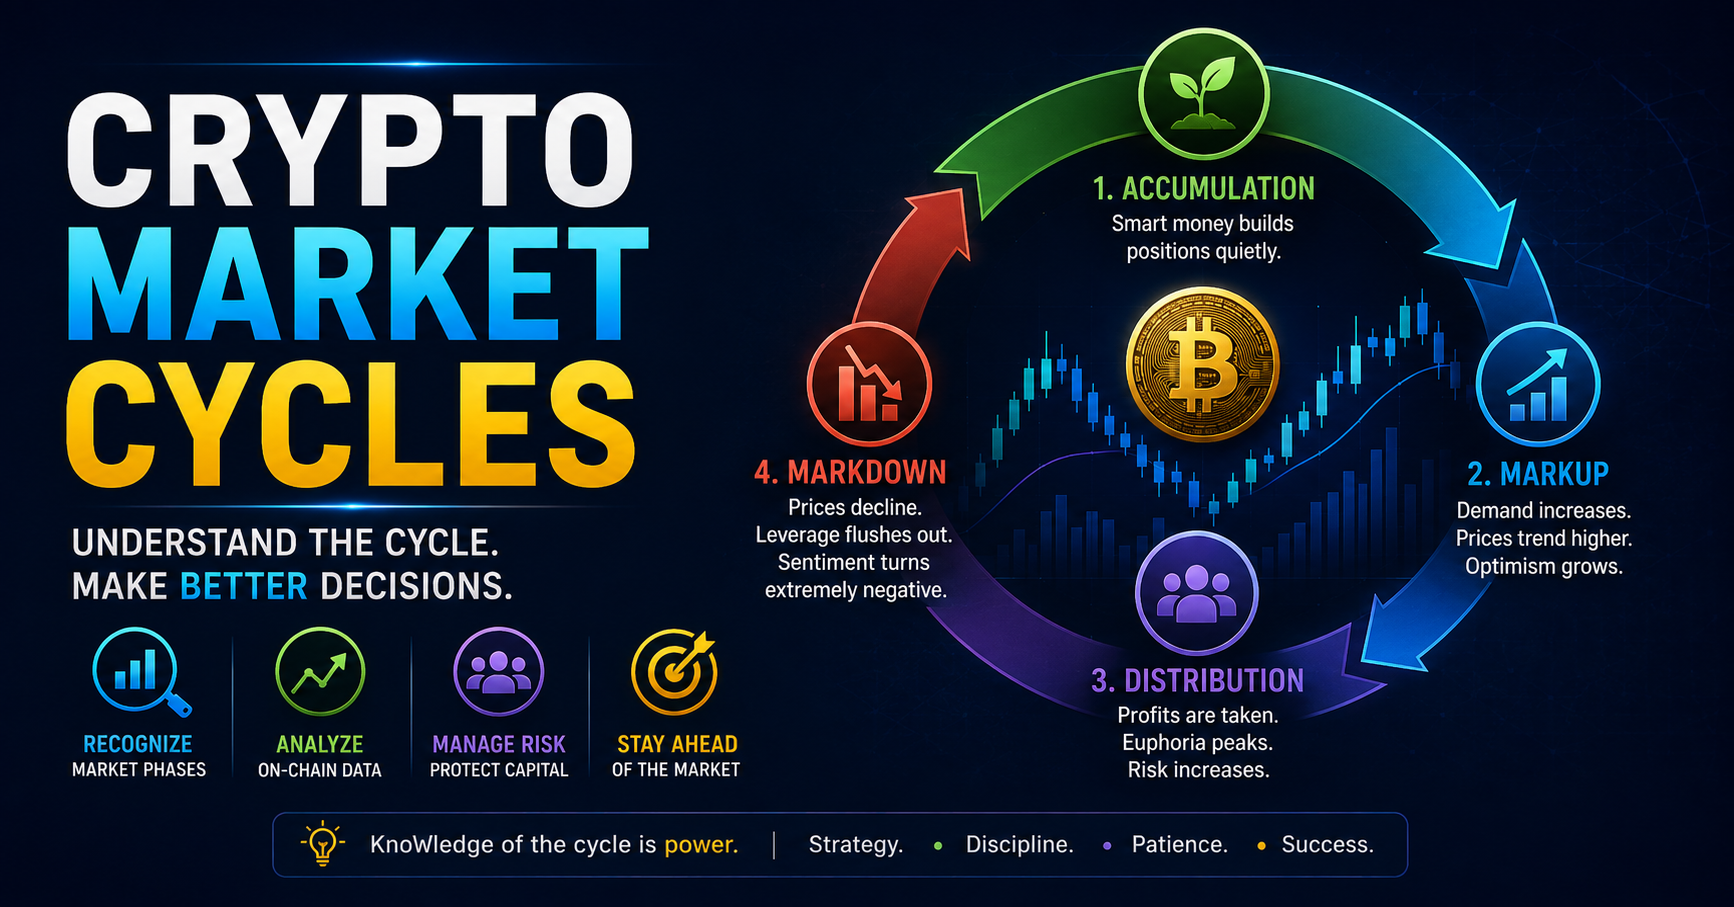
A simplified cycle can be represented as:
Accumulation → Markup → Distribution → Markdown → Accumulation
Understanding these phases does not allow investors to predict market tops and bottoms perfectly.
Instead, market-cycle analysis provides a framework for understanding where market participants may be positioned and how risk conditions are changing.
For cryptocurrency investors, traders, analysts, and blockchain researchers, understanding market cycles is therefore an important component of broader market analysis.
WHAT IS A CRYPTO MARKET CYCLE?
A crypto market cycle describes the transition between periods of rising and falling cryptocurrency valuations.
Cycles develop because markets are influenced by several interacting forces:
- Supply and demand
- Investor psychology
- Market liquidity
- Monetary policy
- Leverage
- Technological development
- Institutional participation
- Regulation
- Network adoption
- Speculation
These forces rarely remain constant.
When liquidity increases and investor confidence improves, demand for risk assets may increase.
When monetary conditions tighten or investor confidence deteriorates, capital may leave speculative markets.
Cryptocurrency markets amplify these movements because they operate continuously, use substantial leverage, attract speculative capital, and contain thousands of assets with dramatically different liquidity characteristics.
THE FOUR-PHASE MARKET CYCLE
One of the simplest ways to understand cryptocurrency market cycles is through four major phases:
- Accumulation
- Markup
- Distribution
- Markdown
Each phase represents different market conditions and different forms of investor behavior.
PHASE 1: ACCUMULATION
Accumulation generally develops following a substantial market decline.
Prices may have fallen significantly from previous highs.
Investor confidence is usually weak.
Mainstream media coverage may have declined.
Trading volumes can become relatively subdued.
Many speculative investors have already exited the market.
This environment can create opportunities for investors who believe that long-term valuations have become attractive.
Instead of buying aggressively, these investors may gradually accumulate positions.
Typical characteristics of accumulation include:
- Sideways price action
- Reduced volatility
- Weak public interest
- Negative sentiment
- Lower trading activity
- Gradual long-term buying
- Reduced speculative leverage
The important characteristic of accumulation is that the market may stop making substantial new lows even though sentiment remains pessimistic.
Price and sentiment can therefore diverge.
The public may remain bearish while stronger buyers gradually absorb available supply.
WHY ACCUMULATION IS DIFFICULT TO IDENTIFY
Accumulation is much easier to identify retrospectively.
At the time it occurs, investors cannot know whether a market has genuinely established a bottom.
What appears to be accumulation may instead be a temporary consolidation before another decline.
This is why experienced investors rarely rely on price alone.
They may examine:
- Trading volume
- On-chain activity
- Exchange balances
- Long-term holder behavior
- Market liquidity
- Macroeconomic conditions
- Network adoption
These indicators provide additional context.
PHASE 2: MARKUP
The markup phase begins when demand becomes strong enough to move prices consistently higher.
Initially, the recovery may attract little attention.
As prices continue rising, confidence improves.
Investors who remained on the sidelines begin returning.
Eventually, broader public participation increases.
Typical characteristics include:
- Higher highs
- Higher lows
- Increasing trading volume
- Improving sentiment
- Greater media attention
- Increased institutional participation
- Rising speculative activity
This phase can continue for months or even years.
BITCOIN’S ROLE IN THE MARKUP PHASE
Bitcoin frequently plays a central role in cryptocurrency market cycles.
During early market recoveries, capital often flows first toward Bitcoin because it has the largest market capitalization, deepest liquidity, longest operating history, and strongest institutional recognition within cryptocurrency markets.
This can cause Bitcoin dominance to rise.
As confidence improves, capital may begin rotating toward other cryptocurrencies.
A simplified rotation might look like:
Bitcoin
↓
Large-cap cryptocurrencies
↓
Ethereum ecosystem
↓
Mid-cap altcoins
↓
Small-cap speculative assets
This sequence is not guaranteed, but capital rotation has been an important characteristic of previous cryptocurrency bull markets.
THE ROLE OF MOMENTUM
Markets are influenced by feedback mechanisms.
When prices rise, investors notice.
When investors notice, additional capital may enter.
Additional demand can push prices higher.
Higher prices generate additional attention.
This creates a positive feedback loop:
Higher Prices
↓
More Attention
↓
More Buyers
↓
Higher Demand
↓
Higher Prices
Eventually, momentum itself becomes part of the investment narrative.
FOMO AND SPECULATION
During strong markup phases, fear of missing out—commonly known as FOMO—can become increasingly important.
Investors may begin purchasing assets because prices are rising rather than because they understand their fundamental value.
Speculation increases.
Social-media activity expands.
New cryptocurrency projects appear.
Trading leverage increases.
Price expectations become progressively more optimistic.
These conditions can eventually contribute to the next stage of the cycle.
PHASE 3: DISTRIBUTION
Distribution generally develops after a prolonged period of rising prices.
Prices may remain near historical highs, but the underlying structure of the market begins changing.
Early investors may start taking profits.
At the same time, new participants may continue entering the market.
This creates a transfer of ownership.
Assets move from investors who accumulated at lower prices toward participants buying at substantially higher valuations.
Common characteristics include:
- High volatility
- Heavy trading volume
- Extreme optimism
- Aggressive price forecasts
- Increased leverage
- Rapid rotation between speculative assets
- Weakening momentum
- Large profit-taking transactions
Distribution does not necessarily produce an immediate market collapse.
Markets can remain elevated for extended periods.
EUPHORIA AS A WARNING SIGNAL
Investor psychology becomes particularly important during distribution.
Bull markets often create narratives suggesting that traditional valuation principles no longer matter.
Statements such as:
“This time is different.”
“Prices can only go higher.”
“Everyone should own cryptocurrency.”
may become increasingly common.
Extreme optimism does not automatically indicate a market top.
However, widespread speculative behavior can indicate that risk has increased substantially.
ON-CHAIN INDICATORS DURING DISTRIBUTION
Blockchain transparency provides analysts with information unavailable in many traditional markets.
During potential distribution phases, analysts may monitor:
- Large exchange deposits
- Whale transactions
- Long-term holder selling
- Realized profits
- Exchange reserves
- Dormant wallet activity
For example, if wallets that accumulated Bitcoin years earlier begin transferring substantial amounts to exchanges, analysts may investigate whether long-term holders are taking profits.
Again, interpretation requires context.
A transfer to an exchange does not automatically mean that an asset will be sold.
PHASE 4: MARKDOWN
Eventually, demand may become insufficient to support elevated valuations.
Prices begin declining.
Initially, investors may interpret the decline as another temporary correction.
Some traders “buy the dip.”
However, if selling pressure continues, market structure can deteriorate.
Lower highs and lower lows begin forming.
Leverage becomes particularly dangerous.
THE ROLE OF LIQUIDATIONS
Cryptocurrency derivatives allow traders to control positions larger than their available capital.
This leverage can amplify both gains and losses.
During declining markets, leveraged long positions may reach liquidation thresholds.
Exchanges automatically close these positions.
Forced selling creates additional downward pressure.
This can produce a cascade:
Price Decline
↓
Long Liquidations
↓
Forced Selling
↓
Further Price Decline
↓
More Liquidations
These liquidation cascades can produce extremely rapid market declines.
CAPITULATION
Toward the later stages of markdown, investor sentiment may become extremely negative.
This is sometimes described as capitulation.
Investors who previously refused to sell may finally exit their positions.
Characteristics may include:
- Large price declines
- Heavy selling volume
- Extreme fear
- Negative media coverage
- Reduced speculative activity
- Project failures
- Investor withdrawals
Eventually, selling pressure becomes exhausted.
Prices begin stabilizing.
The cycle may gradually transition toward accumulation again.
BITCOIN HALVINGS AND MARKET CYCLES
Bitcoin introduces another important factor: the halving.
Approximately every four years, the block reward received by Bitcoin miners is reduced by half.
Historically, halvings have attracted considerable attention because they reduce the rate at which new Bitcoin enters circulation.
Previous Bitcoin cycles have shown major market expansions following halving events.
This has led to the popular concept of the “four-year Bitcoin cycle.”
However, investors should be cautious about treating this relationship as a mechanical forecasting rule.
Bitcoin’s market capitalization is much larger than during earlier cycles.
Institutional participation has increased.
Financial products have evolved.
Macroeconomic conditions differ.
Future cycles may therefore behave differently.
GLOBAL LIQUIDITY
Cryptocurrency does not operate independently from the global financial system.
Liquidity conditions can have a major influence on digital assets.
When central banks maintain relatively accommodative monetary conditions, capital may become more willing to enter risk assets.
When interest rates rise and financial conditions tighten, speculative assets can experience pressure.
Important macroeconomic variables include:
- Interest rates
- Inflation
- Central-bank policy
- Money supply
- Bond yields
- US dollar strength
- Global economic growth
Crypto-cycle analysis should therefore include macroeconomic analysis.
INSTITUTIONAL PARTICIPATION
Institutional participation has changed cryptocurrency market structure.
Institutional investors may access digital assets through:
- Spot markets
- Futures
- Exchange-traded products
- Custody platforms
- Over-the-counter markets
- Investment funds
Institutional capital may alter previous market-cycle patterns.
Markets may become deeper and more liquid, while new sources of leverage and correlation with traditional financial markets may also develop.
CRYPTO MARKET CYCLES AND BITCOIN DOMINANCE
Bitcoin dominance measures Bitcoin’s market capitalization relative to the overall cryptocurrency market.
Changes in dominance can help analysts understand capital rotation.
During periods of uncertainty, investors may favor Bitcoin.
Bitcoin dominance may rise.
During speculative expansion, investors may move toward altcoins.
Bitcoin dominance may fall.
This relationship forms part of what traders sometimes call “altcoin season.”
ALTCOIN SEASON
An altcoin season describes a period in which many cryptocurrencies outperform Bitcoin.
These periods often occur after Bitcoin has already experienced substantial appreciation.
Investors begin searching for higher potential returns.
Capital moves toward:
- Ethereum
- Large-cap altcoins
- DeFi tokens
- Layer 1 networks
- Layer 2 projects
- Gaming tokens
- Meme coins
The further capital moves along the risk spectrum, the greater the potential volatility.
Late-stage speculative rotation can sometimes coincide with increasing market-cycle risk.
STABLECOIN FLOWS
Stablecoins provide another important source of market-cycle information.
Assets such as USDT and USDC are widely used as settlement and trading instruments.
Analysts may monitor:
- Stablecoin issuance
- Exchange stablecoin balances
- Large stablecoin transfers
- Stablecoin market capitalization
Increasing stablecoin liquidity may indicate that capital is available for cryptocurrency purchases.
Declining stablecoin liquidity may indicate reduced market participation.
Again, no single metric provides certainty.
EXCHANGE RESERVES
Exchange reserves measure cryptocurrency held on centralized exchanges.
Large increases in exchange balances can potentially increase immediately available selling supply.
Large withdrawals may suggest movement toward self-custody or long-term storage.
A simplified interpretation is:
Exchange Inflows → Potential Selling Supply
Exchange Outflows → Potential Accumulation
But analysts should avoid interpreting every transfer as a trading signal.
Exchanges routinely reorganize wallets and move assets internally.
WHALE BEHAVIOR
Large cryptocurrency holders can influence market liquidity.
Whale tracking can therefore complement market-cycle analysis.
Analysts may monitor whether whales are:
- Accumulating
- Distributing
- Moving funds to exchanges
- Withdrawing funds
- Deploying stablecoins
- Participating in DeFi
Whale activity becomes particularly interesting when it aligns with other cycle indicators.
LONG-TERM HOLDERS
Bitcoin analysts frequently distinguish between short-term and long-term holders.
Long-term holders may behave differently from speculative traders.
During accumulation phases, long-term holders may increase their positions.
During strong bull markets, some may gradually realize profits.
Tracking these behavioral changes can provide additional information about market-cycle maturity.
REALIZED PROFITS AND LOSSES
Blockchain data can estimate when coins move relative to previous acquisition prices.
This allows analysts to study realized profits and losses.
Large realized profits may indicate that investors are distributing assets during strong markets.
Large realized losses may indicate capitulation during bear markets.
These metrics can help identify changes in investor psychology.
MARKET CYCLES AND TECHNICAL ANALYSIS
Market-cycle analysis becomes more useful when combined with technical analysis.
Useful techniques include:
- Trend analysis
- Support and resistance
- Moving averages
- Momentum indicators
- Volume analysis
- Market structure
For example, an analyst might identify improving on-chain accumulation while price begins establishing higher highs and higher lows.
Multiple forms of confirmation can strengthen an analytical thesis.
THE PSYCHOLOGY OF MARKET CYCLES
Market cycles are ultimately driven partly by human behavior.
Common emotional stages include:
Disbelief
Hope
Optimism
Excitement
Euphoria
Anxiety
Denial
Fear
Capitulation
Despair
Recovery
These emotions influence decision-making.
Investors frequently become most optimistic after substantial price increases and most pessimistic after substantial declines.
This creates one of the central paradoxes of investing:
Perceived risk often feels lowest when prices are highest.
Perceived risk often feels highest when prices are lowest.
COMMON MISTAKES WHEN ANALYZING CYCLES
Mistake 1: Assuming History Must Repeat
Historical cycles provide context, not certainty.
Mistake 2: Trying to Identify the Exact Top
Market tops are rarely obvious in real time.
Mistake 3: Trying to Identify the Exact Bottom
Bottoms are similarly difficult to identify.
Mistake 4: Ignoring Macroeconomics
Cryptocurrency increasingly interacts with global financial markets.
Mistake 5: Ignoring Risk Management
Even an accurate long-term thesis can experience substantial short-term losses.
Mistake 6: Treating Every Indicator as a Trading Signal
Indicators should provide evidence, not automatic instructions.
RISK MANAGEMENT THROUGH MARKET CYCLES
Understanding market cycles should improve risk management rather than encourage prediction.
Investors may adjust exposure according to changing conditions.
Risk-management techniques include:
- Position sizing
- Diversification
- Stop-loss strategies
- Gradual accumulation
- Gradual profit-taking
- Avoiding excessive leverage
- Maintaining liquidity
- Defining maximum acceptable losses
Surviving adverse market conditions is more important than predicting every movement.
A MULTI-FACTOR APPROACH
The strongest market-cycle analysis combines several categories of information.
PRICE DATA
Is the market trending higher or lower?
ON-CHAIN DATA
Are long-term holders accumulating or distributing?
EXCHANGE DATA
Are assets entering or leaving exchanges?
DERIVATIVES DATA
Is leverage becoming excessive?
MACROECONOMIC DATA
Are financial conditions becoming easier or tighter?
SENTIMENT DATA
Are investors fearful or euphoric?
LIQUIDITY DATA
Is capital entering or leaving cryptocurrency markets?
When multiple indicators point toward similar conditions, confidence in the interpretation may improve.
CRYPTO MARKET CYCLE FRAMEWORK
A simplified analytical framework can therefore be represented as:
ACCUMULATION
Low sentiment
Sideways prices
Long-term buying
Reduced speculation
↓
MARKUP
Rising prices
Increasing participation
Growing liquidity
Improving sentiment
↓
DISTRIBUTION
High valuations
Extreme optimism
Profit-taking
Increasing volatility
↓
MARKDOWN
Falling prices
Liquidations
Declining sentiment
Capitulation
↓
ACCUMULATION
The process begins again.
However, real markets rarely follow this model perfectly.
WHY FUTURE CYCLES MAY BE DIFFERENT
Cryptocurrency markets continue to mature.
Several structural changes may influence future cycles:
- Greater institutional adoption
- Exchange-traded investment products
- Improved regulation
- Professional custody infrastructure
- Increased derivatives activity
- Stablecoin growth
- DeFi development
- Tokenized traditional assets
- Greater integration with global markets
As cryptocurrency becomes more interconnected with traditional finance, future market cycles may increasingly respond to global liquidity and macroeconomic conditions rather than purely cryptocurrency-specific events.
THE VALUE OF CYCLE ANALYSIS
The purpose of market-cycle analysis is not to predict tomorrow’s price.
Its value lies in understanding context.
A trader observing a market after an extended period of appreciation, extreme leverage, speculative enthusiasm, and long-term holder distribution should recognize that the risk environment differs substantially from a market experiencing depressed valuations, low leverage, weak sentiment, and gradual accumulation.
Cycle analysis therefore helps answer a more useful question than:
“What will Bitcoin do tomorrow?”
Instead, it asks:
“What type of market environment are we currently operating in?”
CONCLUSION
Crypto market cycles provide a framework for understanding the recurring transitions between pessimism, accumulation, expansion, speculation, distribution, contraction, and eventual recovery.
The four broad phases are:
Accumulation
Markup
Distribution
Markdown
These phases are influenced by investor psychology, liquidity, leverage, Bitcoin supply dynamics, institutional participation, macroeconomic conditions, stablecoin flows, exchange activity, and on-chain behavior.
No indicator can identify market-cycle turning points with certainty.
Bitcoin halvings do not guarantee bull markets.
Exchange inflows do not guarantee selling.
Whale movements do not automatically predict price direction.
Historical patterns do not guarantee future outcomes.
The strongest approach therefore combines multiple forms of evidence.
Technical analysis explains price behavior.
On-chain analysis reveals blockchain activity.
Macroeconomic analysis explains broader liquidity conditions.
Derivatives data identifies leverage.
Sentiment analysis provides insight into investor psychology.
Together, these tools create a more complete picture of the market.
Ultimately, understanding crypto market cycles is not about perfectly predicting tops and bottoms.
It is about recognizing when conditions are changing.
Markets move.
Liquidity changes.
Sentiment shifts.
Risk expands and contracts.
Understanding those transitions can help investors and traders make more disciplined decisions throughout the cryptocurrency market cycle.
No responses yet