INTRODUCTION
Financial markets are enormous networks of buyers and sellers continuously competing for liquidity.
Every movement in price ultimately results from transactions.
Someone buys.
Someone sells.
Orders are submitted, matched, modified, cancelled, partially filled, or executed across different venues.
For retail traders, it can be tempting to view a chart simply as a sequence of candlesticks.
Institutional traders tend to face a different problem.
Banks, hedge funds, pension funds, asset managers, proprietary trading firms, corporations, and other professional participants may need to execute positions worth millions or even billions of dollars.
Executing an order of this size is fundamentally different from placing a small retail trade.
A retail trader may be able to buy EUR/USD, Bitcoin, an equity, or a futures contract almost instantly without materially affecting the market.
An institution attempting to execute an enormous position may not have that luxury.
If it reveals its entire demand to the market at once, price may move against it before the order is completed.
Institutional execution therefore involves liquidity, timing, market impact, transaction costs, execution algorithms, order fragmentation, and sophisticated risk management.
The resulting activity is broadly described as institutional order flow.
Understanding institutional order flow can provide traders with a deeper perspective on market structure.
Rather than asking only:
“Where is price going?”
order-flow analysis asks:
“How are buyers and sellers interacting, where is liquidity located, and what does the behaviour of price and volume suggest about participation?”
This distinction is important.
WHAT IS ORDER FLOW?
Order flow describes the stream of buying and selling instructions entering a market.
At the most basic level, markets contain two sides:
Buyers
and
Sellers.
However, orders can behave differently.
A trader can provide liquidity by placing a limit order.
Alternatively, a trader can demand liquidity by submitting an aggressive order that executes against available orders.
Price changes as aggressive buyers and sellers interact with available liquidity.
If aggressive buying overwhelms available selling liquidity at a particular price, transactions begin occurring at higher prices.
If aggressive selling overwhelms available buying liquidity, prices move lower.
Order-flow analysis therefore examines the mechanics underlying price movement.
WHAT MAKES INSTITUTIONAL ORDER FLOW DIFFERENT?
The principal difference is scale.
Consider a retail trader wanting to buy $5,000 worth of an asset.
In a liquid market, the transaction may have virtually no effect on price.
Now imagine an institution wanting to acquire $500 million of the same asset.
Executing the entire transaction immediately could consume substantial available liquidity.
The institution might receive increasingly unfavorable prices as its order moves through the market.
This phenomenon is known as market impact.
Consequently, institutional traders frequently attempt to minimize their footprint.
WHO CREATES INSTITUTIONAL ORDER FLOW?
Institutional market participants can include:
- Investment banks
- Commercial banks
- Hedge funds
- Pension funds
- Mutual funds
- Asset managers
- Sovereign wealth funds
- Insurance companies
- Proprietary trading firms
- Market makers
- High-frequency trading firms
- Large corporations
- Commodity producers
- Central banks
Different institutions have different objectives.
A hedge fund may speculate on currency movements.
A pension fund may rebalance a diversified portfolio.
A corporation may hedge foreign-exchange exposure.
A market maker may continuously provide liquidity.
A central bank may intervene in a currency market.
Consequently, large transactions do not necessarily indicate the same motivation.
THE INSTITUTIONAL EXECUTION PROBLEM
Suppose an investment fund wants to purchase a very large position.
The fund faces several challenges.
First, there must be sufficient sellers.
Second, the institution wants to avoid pushing the market dramatically higher while accumulating the position.
Third, other market participants may detect the activity and attempt to trade ahead of the order.
Fourth, execution costs must be controlled.
The institution may therefore divide the parent order into many smaller child orders.
Instead of:
BUY 100,000 CONTRACTS NOW
execution may resemble:
Buy a portion.
Wait for liquidity.
Buy another portion.
Allow sellers to replenish.
Continue execution.
This process may occur over minutes, hours, days, or longer depending on the asset and strategy.
ORDER FRAGMENTATION
Breaking a large order into smaller components is known as order fragmentation.
Modern execution algorithms can automate this process.
Common execution approaches include:
TWAP
Time-Weighted Average Price strategies distribute orders over a specified period.
VWAP
Volume-Weighted Average Price strategies attempt to execute relative to expected market volume.
POV
Percentage-of-Volume algorithms attempt to participate at a specified percentage of market activity.
Implementation Shortfall
These algorithms attempt to balance execution speed against market impact and opportunity cost.
Iceberg Orders
Only part of a larger order may be displayed publicly while additional quantity remains hidden.
These techniques demonstrate why institutional activity is not always obvious from individual transactions.
LIQUIDITY: THE FOUNDATION OF ORDER FLOW
Liquidity is one of the most important concepts in institutional trading.
Liquidity describes the ability to buy or sell an asset without causing excessive price movement.
A highly liquid market generally has:
Tight bid-ask spreads.
Substantial market depth.
High transaction volume.
Numerous participants.
Efficient execution.
Institutions require liquidity because large orders need counterparties.
A buyer needs sellers.
A seller needs buyers.
This creates an important relationship between institutional execution and areas containing concentrated orders.
WHERE DOES LIQUIDITY ACCUMULATE?
Orders often cluster around recognizable market structures.
Examples can include:
Previous highs.
Previous lows.
Session highs and lows.
Support and resistance areas.
Round numbers.
Breakout levels.
Option strike prices.
Recent consolidation boundaries.
Stop-loss concentrations.
These areas can attract significant activity because many market participants observe similar levels.
STOP ORDERS AND LIQUIDITY
Consider a market trading below an obvious previous high.
Above that high there may be:
Stop-loss orders from short sellers.
Breakout buy orders.
Algorithmic momentum orders.
Other resting or conditional orders.
If price trades through the previous high, these orders can become active.
The resulting surge in transactions creates liquidity and volatility.
This is why markets sometimes accelerate rapidly after breaking significant levels.
LIQUIDITY SWEEPS
A liquidity sweep occurs when price moves through an area containing concentrated orders before potentially reversing.
For example:
Price approaches a previous high.
The high is broken.
Buy-stop orders activate.
Short positions are stopped out.
Liquidity increases.
Aggressive selling appears.
Price falls back below the previous high.
Some traders refer to this behaviour as a stop run or liquidity grab.
However, terminology should be used carefully.
A move through a previous high does not prove that a particular institution deliberately manipulated stop orders.
Markets can reach these levels naturally because that is where orders exist.
MARKET ORDERS AND LIMIT ORDERS
Understanding order flow requires distinguishing between liquidity providers and liquidity takers.
LIMIT ORDERS
A limit order specifies the price at which a trader is willing to transact.
Limit orders can provide liquidity to the market.
MARKET ORDERS
A market order prioritizes immediate execution.
Market orders consume available liquidity.
If aggressive buyers repeatedly execute against offers, this represents buying pressure.
If aggressive sellers repeatedly execute against bids, this represents selling pressure.
The interaction between these participants contributes to price discovery.
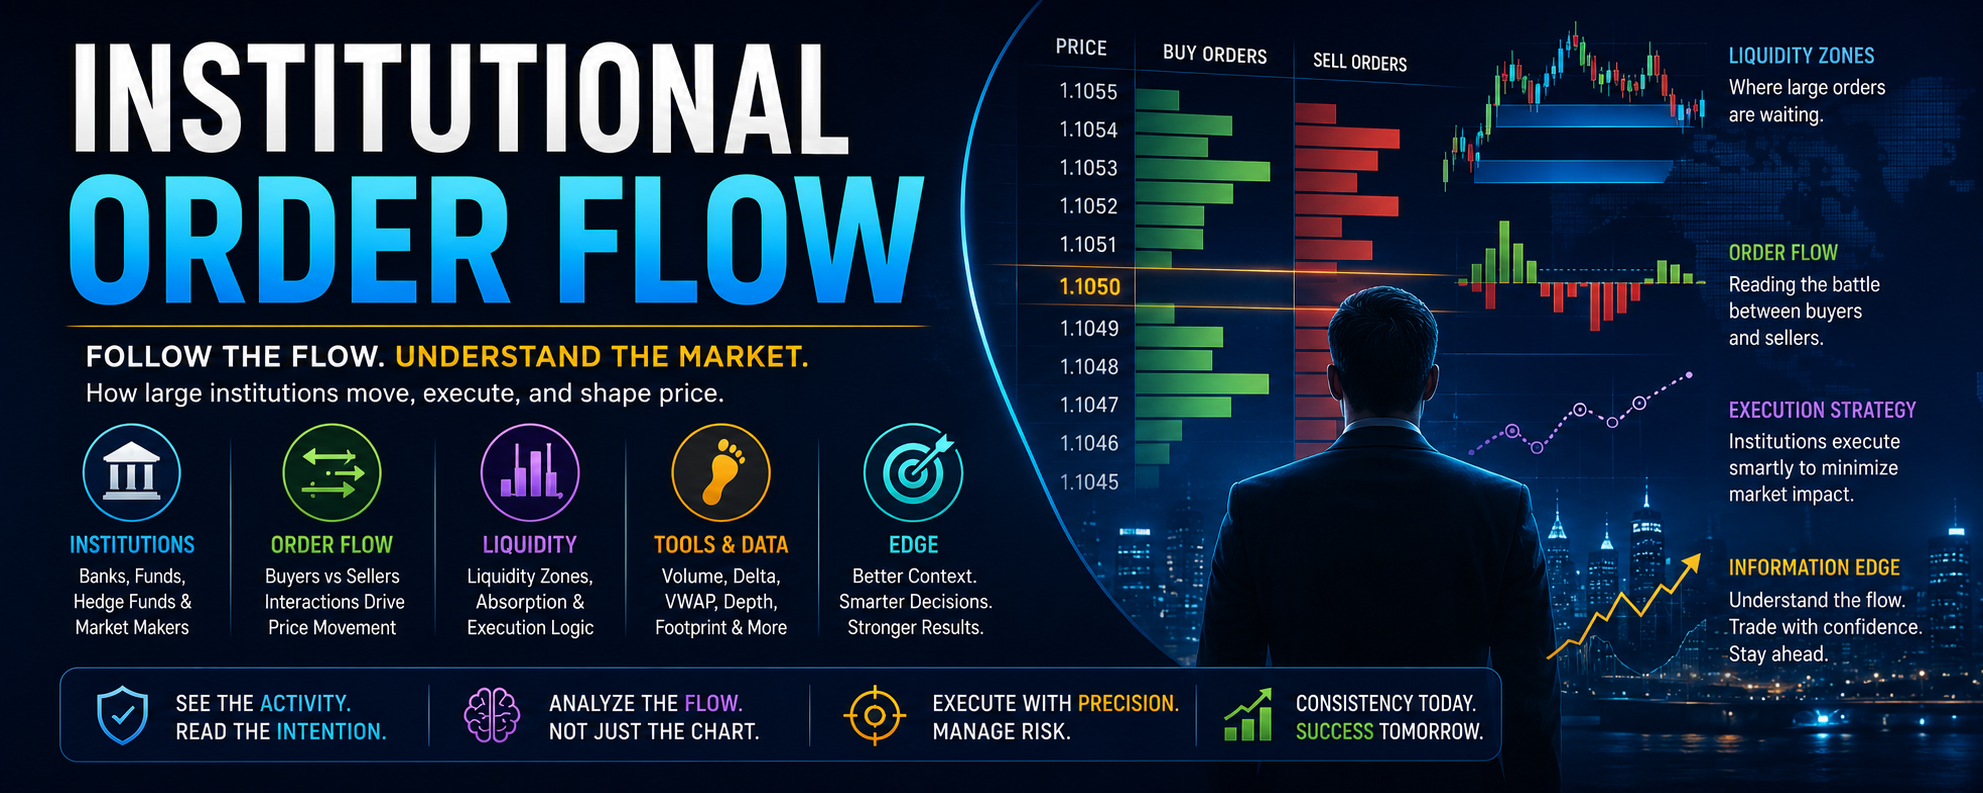
THE ORDER BOOK
In centralized markets, the order book displays available bids and offers.
For example:
SELL ORDERS
1.1053
1.1052
1.1051
CURRENT MARKET
1.1050
BUY ORDERS
1.1049
1.1048
1.1047
Market depth indicates how much liquidity is available at different prices.
However, the visible order book has limitations.
Orders can be cancelled.
Some liquidity may be hidden.
Orders can be placed strategically.
Different venues may contain different liquidity.
Consequently, the visible order book should not be treated as a complete representation of institutional intentions.
FOREX AND THE DECENTRALIZED MARKET
Institutional order-flow analysis is particularly interesting in foreign exchange.
Unlike centralized futures exchanges, the spot FX market is decentralized.
There is no single global EUR/USD order book containing every transaction.
Liquidity is distributed across:
Banks.
Electronic communication networks.
Dealers.
Prime brokers.
Liquidity providers.
Trading platforms.
This means retail traders cannot see the complete global institutional order flow in spot Forex.
Any claim that a retail chart reveals every institutional order should therefore be treated cautiously.
FUTURES AS AN ORDER-FLOW PROXY
Because futures markets operate through centralized exchanges, they provide richer transaction data.
Currency futures, equity-index futures, commodity futures, and other contracts can provide information including:
Volume.
Time and sales.
Bid and ask transactions.
Market depth.
Open interest.
Footprint charts.
Some Forex traders therefore study currency futures data as an additional source of information about institutional participation.
VOLUME ANALYSIS
Volume measures trading activity.
High volume indicates substantial participation.
Low volume indicates relatively limited participation.
Volume becomes particularly useful when interpreted alongside price behaviour.
For example:
Rising price + increasing volume
may indicate strong participation.
Rising price + declining volume
may indicate weakening participation.
Large volume + little price movement
may indicate absorption.
Volume does not identify the participant automatically, but it helps reveal where significant transactions occurred.
ABSORPTION
Absorption is an important order-flow concept.
Imagine aggressive sellers repeatedly hitting the bid.
Normally, strong selling pressure might push prices significantly lower.
But suppose price barely declines.
This may indicate that large passive buyers are absorbing the selling.
Conceptually:
Aggressive Sellers
↓
Large Passive Buyer
↓
Selling Absorbed
↓
Price Holds
If selling pressure eventually becomes exhausted, price may rise.
The opposite can occur at market highs.
Aggressive buyers may repeatedly lift offers while large passive sellers absorb demand.
ORDER-FLOW IMBALANCE
An imbalance occurs when buying or selling activity becomes disproportionately strong.
For example:
Buy Volume: 4,500 contracts
Sell Volume: 1,200 contracts
This may indicate aggressive buying.
Footprint charts can visualize these differences at individual price levels.
However, aggressive buying does not guarantee that price will rise.
If a large passive seller absorbs all the buying, price may fail to advance.
Context remains essential.
CUMULATIVE DELTA
Delta generally compares aggressive buying volume with aggressive selling volume.
A simplified formula is:
Delta = Buy Volume – Sell Volume
Positive delta indicates greater aggressive buying.
Negative delta indicates greater aggressive selling.
Cumulative delta tracks this difference over time.
Analysts may compare cumulative delta with price.
For example:
Price makes a new high.
Cumulative delta fails to make a new high.
This divergence may suggest weakening aggressive participation.
Again, divergence is evidence—not certainty.
FOOTPRINT CHARTS
Traditional candlestick charts show:
Open.
High.
Low.
Close.
Footprint charts add transaction information inside each candle.
They may show:
Bid volume.
Ask volume.
Delta.
Imbalances.
Volume at price.
This allows analysts to examine how transactions occurred within the candle rather than merely observing the final OHLC structure.
VOLUME PROFILE
Volume profile shows how much trading occurred at different price levels.
Instead of displaying volume by time, it displays volume by price.
Important concepts include:
Point of Control (POC)
The price with the highest traded volume.
Value Area
The region containing a large proportion of trading activity.
High-Volume Nodes
Areas where substantial transactions occurred.
Low-Volume Nodes
Areas where relatively little trading occurred.
Institutions may care about these regions because they reveal where the market has previously accepted or rejected prices.
VWAP
Volume-Weighted Average Price is widely used in institutional trading.
VWAP represents the average traded price weighted by volume.
A simplified formula is:
VWAP =
Sum of (Price × Volume)
÷
Total Volume
Institutional traders may benchmark execution against VWAP.
If a fund needs to purchase a large position, achieving an average execution price below the session VWAP may indicate relatively efficient execution.
Retail traders also use VWAP as a reference for market positioning and intraday value.
BLOCK TRADES
Block trades are unusually large transactions.
They may involve institutions executing significant positions, sometimes through specialized mechanisms designed to minimize market disruption.
Monitoring block activity can provide information about large-scale participation.
However, the direction and motivation of the trade may not always be obvious.
DARK POOLS
Equity markets contain alternative trading systems commonly known as dark pools.
These venues allow participants to execute orders without displaying the complete order publicly before execution.
Institutions use dark pools partly because exposing a large order to the public market could create adverse market impact.
This illustrates an important limitation of institutional order-flow analysis:
Not all institutional activity is visible in real time.
ALGORITHMIC EXECUTION
Modern institutional trading is heavily automated.
Algorithms may determine:
When to execute.
Where to execute.
How much to execute.
Which venue to use.
How aggressively to trade.
Whether to provide or consume liquidity.
Execution decisions can occur in milliseconds.
Institutional order flow therefore reflects not only human decisions but sophisticated automated execution systems.
SMART MONEY: USE THE TERM CAREFULLY
The phrase “smart money” is frequently used in retail trading.
It generally refers to sophisticated institutional participants.
However, institutions are not always correct.
Hedge funds lose money.
Banks misjudge markets.
Asset managers underperform.
Institutional positions can be forced to liquidate.
Consequently:
Institutional ≠ Infallible
The objective of order-flow analysis is not to blindly copy institutions.
It is to understand market mechanics.
MARKET STRUCTURE AND ORDER FLOW
Order flow becomes more useful when combined with market structure.
Market structure examines relationships between:
Higher highs.
Higher lows.
Lower highs.
Lower lows.
Trading ranges.
Breakouts.
Support.
Resistance.
An order-flow signal occurring at an important structural level may be more informative than the same signal occurring randomly.
EXAMPLE: BULLISH ABSORPTION AT SUPPORT
Suppose EUR/USD approaches an established support level.
Selling volume increases substantially.
Yet price fails to break significantly lower.
Order-flow data shows heavy selling being absorbed.
Price then begins recovering.
An analyst might interpret this as evidence that buyers defended the area.
The analytical sequence becomes:
Support Level
↓
Heavy Selling
↓
Selling Absorbed
↓
Price Holds
↓
Buying Emerges
↓
Potential Reversal
This is stronger than simply assuming that support must hold.
EXAMPLE: FAILED BREAKOUT ABOVE RESISTANCE
Consider a market approaching a previous high.
Price breaks above resistance.
Aggressive buying increases sharply.
However, price fails to continue higher.
Large selling absorbs the buying.
Price falls back below resistance.
The sequence becomes:
Previous High
↓
Breakout
↓
Buy Stops Triggered
↓
Aggressive Buying
↓
Selling Absorbs Demand
↓
Failed Breakout
↓
Potential Reversal
Again, this represents an interpretation rather than a guaranteed trade.
INSTITUTIONAL ORDER FLOW AND NEWS
Macroeconomic events can dramatically change order flow.
Important examples include:
Central-bank interest-rate decisions.
Inflation reports.
Employment data.
GDP releases.
Geopolitical developments.
Corporate earnings.
Unexpected policy announcements.
During major events, liquidity providers may temporarily reduce available liquidity.
Spreads can widen.
Volatility can increase.
Large market orders may therefore produce unusually large price movements.
FOREX INSTITUTIONAL FLOWS
In currency markets, institutions transact for many reasons.
A multinational corporation may need to convert revenue from one currency into another.
An asset manager may hedge international investments.
A hedge fund may speculate on monetary policy.
A bank may manage client transactions.
A central bank may intervene.
Therefore, institutional FX order flow reflects both speculative and non-speculative activity.
ORDER FLOW AND TIME OF DAY
Liquidity changes throughout the trading day.
Forex activity often increases during major sessions:
London.
New York.
Tokyo.
Session overlaps can create particularly active conditions.
Institutional execution strategies may adapt to these liquidity patterns.
Executing large positions when liquidity is deeper can reduce market impact.
ORDER FLOW AND SUPPORT/RESISTANCE
Traditional support and resistance analysis can be enhanced with order-flow information.
Instead of merely observing that price reached resistance, analysts can ask:
Did volume increase?
Were buyers aggressive?
Was buying absorbed?
Did price accept the higher level?
Did price immediately reject it?
Was the breakout supported by participation?
This transforms support and resistance from static lines into areas of market interaction.
ORDER FLOW AND CANDLESTICK ANALYSIS
Candlesticks show the outcome of trading during a period.
Order flow can help explain how the candle formed.
Consider a bearish-looking candle with a long lower wick.
The candlestick indicates rejection of lower prices.
Order-flow analysis may reveal:
Heavy aggressive selling.
Large passive buying.
Selling exhaustion.
Strong buying near the low.
Together, the information provides richer context than the candle alone.
INSTITUTIONAL ORDER FLOW AND LIQUIDITY POOLS
Retail trading literature often describes “liquidity pools.”
In practical terms, these are areas where substantial orders may be concentrated.
Potential locations include:
Above previous highs.
Below previous lows.
Around major round numbers.
Near session extremes.
Around heavily traded zones.
Institutions may seek these regions because large transactions require counterparties.
However, traders should avoid assuming that every movement toward liquidity is deliberate institutional manipulation.
FALSE BREAKOUTS
False breakouts are common around important levels.
Price moves beyond support or resistance but fails to continue.
Order-flow analysis can help distinguish between:
Acceptance
and
Rejection.
If price breaks resistance and substantial volume continues trading above the level, the market may be accepting higher prices.
If price immediately returns below resistance despite aggressive buying, rejection may be occurring.
OPEN INTEREST
In derivatives markets, open interest measures outstanding contracts.
Changes in open interest can provide additional context.
For example:
Price rising + open interest rising
may indicate new positions entering.
Price rising + open interest falling
may indicate short covering.
Price falling + open interest rising
may indicate new bearish positioning.
Price falling + open interest falling
may indicate long liquidation.
These are simplified interpretations and should be evaluated alongside other data.
INSTITUTIONAL POSITIONING DATA
Some markets provide additional information about participant positioning.
For example, futures markets may publish aggregated categories of trader positions.
These datasets can help analysts understand whether commercial participants, asset managers, leveraged funds, or other categories are increasing or reducing exposure.
Such information is generally slower than real-time order flow but can provide useful macro context.
LIMITATIONS OF ORDER-FLOW ANALYSIS
Institutional order-flow analysis has significant limitations.
FIRST:
A retail trader usually cannot identify exactly who executed a transaction.
SECOND:
Large transactions may be hedges rather than directional speculation.
THIRD:
Visible orders can be cancelled.
FOURTH:
Hidden liquidity may exist.
FIFTH:
Spot Forex is decentralized.
SIXTH:
Institutional execution may occur across multiple venues.
SEVENTH:
Dark pools and OTC transactions reduce transparency.
EIGHTH:
Historical order-flow patterns do not guarantee future outcomes.
These limitations should prevent traders from treating order flow as a perfect market-prediction system.
COMMON BEGINNER MISTAKES
MISTAKE 1: ASSUMING EVERY LARGE ORDER IS INSTITUTIONAL
Large activity does not automatically reveal identity.
MISTAKE 2: ASSUMING INSTITUTIONS ALWAYS WIN
Professional participants can be wrong.
MISTAKE 3: CALLING EVERY STOP RUN MANIPULATION
Price naturally moves toward areas containing liquidity.
MISTAKE 4: IGNORING MARKET CONTEXT
An imbalance means little without understanding market structure.
MISTAKE 5: USING ORDER FLOW WITHOUT RISK MANAGEMENT
No analytical technique eliminates uncertainty.
MISTAKE 6: OVERCOMPLICATING THE CHART
Too many indicators can obscure rather than clarify order flow.
A PRACTICAL ORDER-FLOW FRAMEWORK
A trader can structure analysis using several layers.
STEP 1: IDENTIFY MARKET STRUCTURE
Determine whether the market is:
Trending upward.
Trending downward.
Ranging.
Breaking out.
Reversing.
STEP 2: IDENTIFY IMPORTANT LIQUIDITY AREAS
Mark:
Previous highs.
Previous lows.
Session extremes.
Support.
Resistance.
High-volume regions.
STEP 3: OBSERVE PRICE APPROACH
Does price accelerate?
Does volume increase?
Does volatility expand?
STEP 4: ANALYZE ORDER FLOW
Look for:
Absorption.
Imbalances.
Delta.
Volume expansion.
Failed continuation.
STEP 5: WAIT FOR CONFIRMATION
Do not assume the first interaction determines direction.
STEP 6: DEFINE RISK
Determine:
Entry.
Stop loss.
Position size.
Profit target.
Maximum acceptable loss.
This creates a structured analytical process.
COMBINING ORDER FLOW WITH TECHNICAL ANALYSIS
Institutional order flow should not necessarily replace technical analysis.
The two approaches can complement each other.
Technical analysis identifies:
Trend.
Structure.
Support.
Resistance.
Patterns.
Order-flow analysis investigates:
Participation.
Liquidity.
Aggression.
Absorption.
Execution.
Together they answer two different questions:
Technical Analysis:
“What is price doing?”
Order Flow:
“How is trading activity producing that movement?”
COMBINING ORDER FLOW WITH FUNDAMENTAL ANALYSIS
Fundamental analysis provides another layer.
For Forex:
Interest rates.
Inflation.
Economic growth.
Central-bank policy.
For equities:
Earnings.
Revenue.
Margins.
Guidance.
For cryptocurrencies:
Network activity.
Token supply.
Institutional adoption.
Regulation.
Fundamental context can explain why institutions may be changing exposure.
RISK MANAGEMENT REMAINS ESSENTIAL
No amount of institutional analysis removes market risk.
Unexpected information can instantly alter order flow.
A central-bank announcement can reverse currency markets.
An earnings surprise can gap an equity.
A geopolitical event can dramatically change risk sentiment.
Professional risk management therefore remains essential.
Important principles include:
- Limit risk per trade.
- Avoid excessive leverage.
- Use predefined invalidation levels.
- Adjust position size to volatility.
- Avoid assuming certainty.
- Review execution performance.
- Maintain trading records.
THE FUTURE OF INSTITUTIONAL ORDER-FLOW ANALYSIS
Technology continues to transform market analysis.
Machine learning can analyze enormous quantities of transaction data.
High-frequency systems can process order-book changes in microseconds.
Artificial intelligence can identify patterns across:
Volume.
Market depth.
News.
Cross-asset correlations.
Options markets.
Futures.
Blockchain data.
Alternative datasets.
For cryptocurrency markets, public blockchain data adds another dimension.
Analysts can combine:
Exchange order flow.
Derivatives positioning.
On-chain transactions.
Whale activity.
Stablecoin flows.
Wallet clustering.
This convergence may create increasingly sophisticated models of institutional market behaviour.
THE CENTRAL LESSON
Institutional order-flow analysis changes the way a trader thinks about markets.
A chart is not merely a collection of patterns.
Behind every candle are transactions.
Behind those transactions are buyers and sellers.
Behind those participants are different objectives, constraints, time horizons, algorithms, and capital requirements.
Large institutions face a particularly important constraint:
They need liquidity.
Understanding where liquidity exists and how price behaves when substantial transactions occur can therefore provide valuable information about market structure.
CONCLUSION
Institutional order flow refers to the trading activity generated by large professional market participants including banks, hedge funds, pension funds, asset managers, corporations, market makers, and proprietary trading firms.
Because institutions frequently trade substantial positions, execution becomes a major challenge.
They may fragment orders, use sophisticated algorithms, access multiple venues, seek deeper liquidity, and attempt to minimize market impact.
Their activity can leave observable footprints through:
Volume.
Liquidity behaviour.
Absorption.
Order-flow imbalances.
Block transactions.
VWAP.
Volume profiles.
Cumulative delta.
Market-depth changes.
Price reactions around significant levels.
These tools can help traders understand how buyers and sellers interact.
However, institutional order flow should not be romanticized.
A chart cannot reliably identify every bank transaction.
A liquidity sweep does not prove manipulation.
A large trade does not reveal the participant’s motivation.
Institutional traders are not infallible.
And no order-flow indicator predicts the future with certainty.
The strongest approach therefore combines multiple forms of analysis:
Market Structure
+
Liquidity Analysis
+
Volume
+
Order Flow
+
Technical Analysis
+
Fundamental Context
+
Risk Management
Institutional order-flow analysis is ultimately about understanding market mechanics.
Instead of seeing only candles moving up and down, the analyst begins to see a continuous auction.
Buyers compete with sellers.
Liquidity appears and disappears.
Large orders are accumulated and distributed.
Aggressive participants challenge passive participants.
Prices move toward areas where transactions can occur.
Some moves are accepted.
Others are rejected.
That interaction is the foundation of price discovery.
Understanding institutional order flow therefore does not provide a crystal ball.
It provides something more useful:
A framework for understanding how professional participation, liquidity, execution, and market structure interact to produce the prices displayed on the chart.
No responses yet