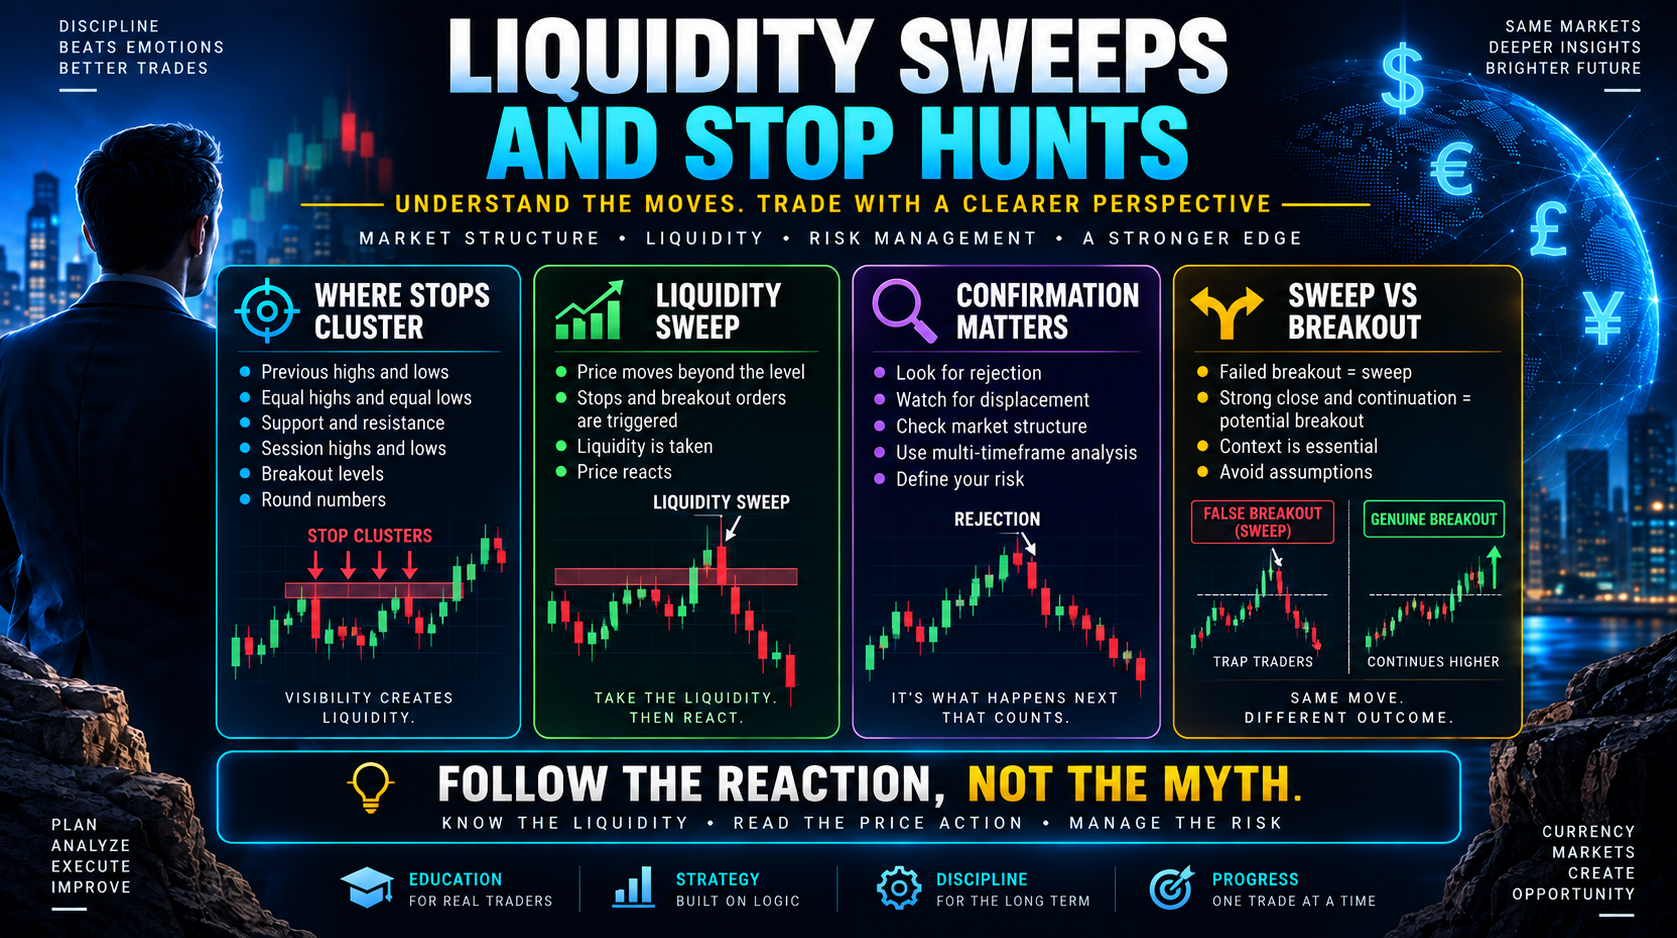
Liquidity Sweeps and Stop Hunts are among the most discussed ideas in modern Forex price-action trading. Traders frequently observe price moving above an established high or below an established low, triggering orders around the level, and then either reversing sharply or continuing in the breakout direction.
These movements are important because previous highs, lows, range boundaries and other obvious technical levels can become areas where orders accumulate. Stop-loss orders, breakout entries, limit orders and institutional execution requirements can all contribute to trading activity around these locations.
However, there is an important distinction between observing a liquidity sweep and claiming that a market participant deliberately hunted retail stops. A price chart can show that a level was breached and rejected. It cannot, by itself, prove who caused the move or why.
This article examines how liquidity works, where stop orders tend to accumulate, how traders can identify potential sweeps, why genuine breakouts must be distinguished from failed ones, and how Liquidity Sweeps and Stop Hunts can fit into a disciplined Forex trading framework.
What Are Liquidity Sweeps and Stop Hunts?
A liquidity sweep occurs when price moves through an area where orders are likely to be concentrated. These areas commonly include previous highs and lows, equal highs and lows, trading-range boundaries and significant support or resistance levels.
Consider a previous swing high. Traders who sold near that level may place their stop-loss orders slightly above it. Other traders expecting a breakout may place buy-stop entry orders above the same high.
If price rises through the high, both categories of orders can become active. Short sellers may be forced to buy to close their positions, while breakout traders enter new long positions.
This creates a concentration of executable buying interest around the level.
If price subsequently falls back below the previous high, traders may describe the movement as a liquidity sweep, stop run, false breakout or, more controversially, a stop hunt.
The terminology differs, but the observable event is straightforward: price crossed a technically significant level where orders were likely to exist and then reacted.
Why Liquidity Matters in Forex
Liquidity is fundamental to financial markets because buyers need sellers and sellers need buyers.
A trader executing a very small EUR/USD position usually has little difficulty finding sufficient opposing liquidity. A large financial institution attempting to execute a substantial position faces a different problem.
Large orders can affect price if insufficient liquidity exists at the desired level. Institutional traders and dealers therefore care deeply about execution quality, available liquidity and market impact.
This relationship is explored more broadly in NetBiz’s Institutional Order Flow analysis, which examines how large market participants execute orders and how those flows can influence price behaviour.
Liquidity should therefore be viewed as part of market mechanics rather than simply as a trading indicator.
Where Does Liquidity Accumulate?
Liquidity can exist throughout the market, but some price areas are more obvious than others.
Common areas watched by liquidity-focused traders include:
- previous swing highs;
- previous swing lows;
- equal highs and equal lows;
- daily highs and lows;
- weekly highs and lows;
- Asian, London and New York session extremes;
- range boundaries;
- major support and resistance areas;
- round numbers; and
- well-observed breakout levels.
The common characteristic is visibility. When many traders can identify the same level, similar trading decisions may cluster around it.
Liquidity Above Previous Highs
Above a previous high there may be stop-loss orders belonging to short sellers as well as buy-stop orders from traders anticipating an upside breakout.
Liquidity-focused trading frameworks often call this buy-side liquidity.
Liquidity Below Previous Lows
Below a previous low there may be stop-loss orders from long positions and sell-stop entries from traders expecting a bearish breakout.
This is commonly described as sell-side liquidity.
How Stop-Loss Orders Create Liquidity
A stop-loss is designed to close a position when price reaches a predefined invalidation level.
For a trader holding a long position, the stop normally generates a sell order when triggered. For a trader holding a short position, the stop generates a buy order.
This is why obvious technical areas can attract attention.
Suppose thousands of market participants identify the same resistance level and establish short positions. Many may place stops just above that resistance. The market does not reveal all those retail stops through one global order book, but their clustering can still contribute to activity when the level is reached.
The same principle applies beneath support.
It is important, however, not to imagine liquidity as a precise line containing a known quantity of orders. Liquidity is dynamic. Orders are placed, cancelled, modified, internalised and executed across multiple venues.
Understanding Buy-Side Liquidity Sweeps
A buy-side liquidity sweep occurs when price moves above an important high and subsequently rejects the area.
A hypothetical sequence might look like this:
- EUR/USD establishes a visible swing high.
- Price retreats from the high.
- Short sellers place protective stops above it.
- Breakout traders place buy-stop entries above it.
- Price later trades through the previous high.
- Those orders begin to execute.
- Price fails to sustain the breakout.
- The market falls back beneath the old high.
The final rejection is critical. Simply trading above the previous high does not establish that a sweep has occurred in a useful trading sense. The market may instead be beginning a legitimate bullish breakout.
Understanding Sell-Side Liquidity Sweeps
A sell-side sweep is the opposite process.
Imagine GBP/USD has established a significant swing low. Long traders may position protective stops beneath the low, while bearish breakout traders place sell-stop entries below it.
Price subsequently trades below the low, activating those orders, but then recovers rapidly and closes back above the level.
Liquidity-focused traders may interpret the movement below the low as a sell-side liquidity sweep.
Again, confirmation matters. If price continues falling strongly after breaking the low, the event was more consistent with a successful bearish breakout than a reversal-oriented liquidity sweep.
Are Stop Hunts Deliberate Market Manipulation?
The phrase “stop hunt” often implies intentional manipulation. This is where traders need to distinguish observation from inference.
A trader can objectively observe that:
- an established high existed;
- price moved above it;
- the breakout failed;
- price returned beneath the level; and
- a significant reversal followed.
What the chart cannot independently prove is that a particular bank, hedge fund, dealer or algorithm deliberately moved price for the purpose of taking retail traders’ stops.
The global Forex market is exceptionally large and structurally complex. According to the Bank for International Settlements 2025 Triennial Central Bank Survey, global OTC foreign-exchange turnover reached trillions of US dollars per day.
Trading occurs among banks, non-bank financial institutions, asset managers, corporations, hedge funds, proprietary firms and other participants with different objectives.
A movement through an obvious stop area can therefore result from normal liquidity-seeking behaviour, hedging, genuine directional demand, algorithmic execution, economic news or changing market expectations.
Liquidity Sweeps and Stop Hunts in Smart Money Concepts
Liquidity Sweeps and Stop Hunts play a major role in Smart Money Concepts because SMC places considerable emphasis on liquidity around previous highs and lows.
NetBiz’s guide to Smart Money Concepts in Forex explains how liquidity, market structure, displacement, fair value gaps and order blocks can be combined into a broader price-action framework.
Within that framework, traders generally avoid treating a sweep as an entry signal by itself.
Instead, they may wait for additional evidence after liquidity has been taken.
Liquidity Sweep
Price trades beyond an established liquidity area.
Rejection
Price fails to maintain acceptance beyond the level and returns toward the previous range.
Displacement
A strong directional move develops away from the swept area.
Market Structure Shift
Price breaks an important lower-timeframe swing in the new direction.
Combining these stages can provide a more structured approach than automatically entering against every breakout.
Liquidity Sweeps vs Genuine Breakouts
One of the greatest practical difficulties is distinguishing a liquidity sweep from a genuine breakout.
Both begin in the same way: price moves beyond a previous technical boundary.
A genuine breakout may show:
- strong closes beyond the level;
- continued directional momentum;
- acceptance above former resistance or below former support;
- successful retesting of the broken level;
- continued structural progression; and
- fundamental or macroeconomic support for the move.
A failed breakout or sweep may instead show:
- a brief excursion beyond the level;
- rapid rejection;
- long candle wicks;
- a close back inside the previous range;
- displacement in the opposite direction; and
- a subsequent break of nearby market structure.
There is no perfect distinction in real time. Traders work with probabilities rather than certainty.
For additional context on breakout mechanics, see NetBiz’s Breakout Trading Strategy for GBPUSD & Gold.
Equal Highs and Equal Lows as Liquidity Areas
Equal highs and equal lows are particularly popular in liquidity-based analysis because they are easy for market participants to recognise.
If price reaches approximately the same high several times without breaking through, traders may interpret the area as resistance.
Short sellers may enter around the highs and place stops above them. Breakout traders may simultaneously prepare buy orders above the same region.
The result is a logical area of interest.
Equal lows create the reverse situation.
However, the fact that liquidity may exist beyond equal highs or lows does not mean the market must sweep them. Price can reverse before reaching the level or break through and continue without returning.
Support and Resistance vs Liquidity
Traditional technical analysis and liquidity analysis frequently describe the same chart from different perspectives.
A traditional trader might call an old high “resistance.” A liquidity-focused trader may describe the orders above it as buy-side liquidity.
Neither description necessarily invalidates the other.
Support and resistance identify areas where price previously reacted. Liquidity analysis asks what types of orders may exist around those areas and what might happen when price trades through them.
This overlap is useful because traders do not need to abandon established technical analysis simply to incorporate liquidity concepts.
Session Highs and Lows
Forex trading activity varies throughout the global trading day.
Session highs and lows can become useful liquidity reference points because they represent clearly visible intraday extremes.
Asian Session
Some major currency pairs establish relatively contained ranges during parts of the Asian trading session. European participation can later challenge those boundaries.
London Session
London is one of the world’s most important foreign-exchange centres. Increased activity around the European trading day can generate moves beyond earlier session highs or lows.
New York Session
US economic releases and the London-New York overlap can introduce substantial additional volume and volatility.
Traders sometimes observe a session high or low being breached shortly before a larger directional move. But session-based patterns should be tested rather than assumed to repeat every day.
News Events and Apparent Stop Hunts
Economic news can produce price behaviour that visually resembles a stop hunt.
Major events include:
- central-bank interest-rate decisions;
- inflation reports;
- employment data;
- GDP releases;
- unexpected political developments;
- central-bank speeches; and
- geopolitical shocks.
When new information reaches the market, participants rapidly adjust positions. Liquidity can deteriorate temporarily, spreads can widen and price can move sharply through nearby technical levels.
Calling every such movement manipulation ignores the genuine repricing process taking place.
Why Retail Traders Often Feel Their Stops Are Targeted
There is a psychological reason stop hunts appear highly personal.
A trader identifies support, enters a long position and places a stop slightly below the obvious low. Price falls just far enough to activate the stop and then rallies.
From the trader’s perspective, the market appears to have specifically targeted the position.
But many other traders may have identified exactly the same level and made similar decisions.
The problem may therefore be less about an individual trader being targeted and more about predictable order placement around an obvious technical structure.
This provides an important trading lesson: an obvious stop location can also be an obvious liquidity location.
Using Market Structure After a Liquidity Sweep
A liquidity event becomes more informative when combined with market structure.
Suppose EUR/USD is in a higher-timeframe uptrend and retraces toward a previous daily low.
Price briefly trades below that low, potentially taking sell-side liquidity. Rather than buying immediately, a trader could wait for price to recover and break a significant lower-timeframe swing high.
The sequence becomes:
- higher-timeframe bullish structure;
- retracement into an area of interest;
- sell-side liquidity sweep;
- bullish rejection;
- bullish displacement;
- lower-timeframe structure break; and
- defined entry and invalidation.
This creates multiple layers of evidence rather than relying on the sweep alone.
Displacement After Liquidity Is Taken
Displacement refers to a decisive directional movement away from an area.
It may be characterised by relatively large candle bodies, limited overlap and a rapid break of nearby structure.
After a liquidity sweep, displacement can indicate that the market strongly rejected prices beyond the swept level.
For example, a small wick above a previous high followed by several indecisive candles provides relatively weak information. A sweep followed by a large bearish move through multiple short-term lows provides a much clearer structural response.
Even then, displacement does not guarantee continuation. It simply adds evidence to the trading hypothesis.
Multi-Timeframe Analysis of Liquidity Sweeps and Stop Hunts
Liquidity Sweeps and Stop Hunts should be interpreted within a timeframe hierarchy.
A five-minute liquidity sweep may have little importance if it occurs in the middle of an unstructured daily range.
Conversely, a lower-timeframe sweep occurring at a major daily swing low may deserve considerably more attention.
Higher Timeframe
Identify the dominant trend, major highs and lows and important support or resistance areas.
Intermediate Timeframe
Observe how price approaches the area and whether structure is trending or consolidating.
Lower Timeframe
Look for the actual sweep, rejection, displacement and structural confirmation used for execution.
This top-down process helps prevent traders from treating every small intraday wick as an important liquidity event.
A Bullish Liquidity Sweep Example
Imagine EUR/USD is trading within a broader bullish trend.
A previous four-hour swing low is clearly visible at 1.1700. Price retraces toward that level and eventually trades down to 1.1685.
Long-position stops beneath 1.1700 may be triggered, while bearish breakout traders enter short positions.
Price then rapidly recovers above 1.1700.
On the lower timeframe, a strong bullish candle breaks the most recent short-term swing high.
A trader interpreting this as a bullish liquidity sweep might consider a long setup, but only with a predetermined invalidation level and position size.
If price instead remains below 1.1700 and continues forming lower lows, the sweep hypothesis has failed and the bearish breakout interpretation becomes stronger.
A Bearish Liquidity Sweep Example
Now imagine GBP/USD has been trending lower.
A previous significant high exists at 1.3500. During a retracement, price moves through the level to 1.3515.
Stops from short positions may activate and breakout traders may buy above the high.
Price then falls rapidly back below 1.3500 and breaks an important intraday swing low.
A trader might classify the move above 1.3500 as a buy-side liquidity sweep and look for a bearish continuation setup.
But if price instead establishes support above 1.3500 and continues higher, the bearish hypothesis should be abandoned.
Common Mistakes When Trading Liquidity Sweeps
Calling Every Wick a Stop Hunt
Markets constantly trade above and below short-term highs and lows. Most of these movements do not deserve a special label.
Entering Before Confirmation
Immediately fading every breakout can result in repeated losses when genuine trends develop.
Ignoring the Higher Timeframe
A bearish sweep on a one-minute chart can be irrelevant during a powerful higher-timeframe bullish move.
Assuming Manipulation
Attributing every losing trade to institutional stop hunting prevents objective analysis of entry quality, stop placement and market conditions.
Moving the Stop to Avoid Being Swept
Once traders become concerned about stop hunts, they may repeatedly widen their stops. This can transform a controlled loss into a much larger one.
Ignoring Economic News
Price can move violently through technical levels when markets process new information. Traders should know when major scheduled announcements are due.
Stop Placement and Risk Management
Understanding liquidity does not mean traders should stop using stop-loss orders.
A stop is a risk-management mechanism. The objective is to place it at a level where the trading hypothesis is genuinely invalidated rather than merely selecting an arbitrary number of pips.
Traders can consider:
- market structure;
- current volatility;
- average price movement;
- the location of obvious highs and lows;
- position size;
- scheduled economic events; and
- maximum acceptable account risk.
A wider technically justified stop should normally be accompanied by a smaller position size if the trader wants to maintain the same monetary risk.
Advantages and Limitations of Liquidity Analysis
Liquidity analysis can encourage traders to think beyond simple chart patterns.
Potential advantages include:
- greater awareness of where orders may cluster;
- better understanding of failed breakouts;
- improved integration of market structure and execution;
- more deliberate stop placement; and
- a framework for waiting for confirmation.
But there are significant limitations.
Retail traders generally cannot observe the complete global FX order book. Potential liquidity zones are therefore inferred rather than known precisely.
The BIS has documented the increasingly fragmented and partially non-visible nature of FX execution. Dealer internalisation also means that significant client activity can be matched without necessarily appearing as straightforward market-facing flow.
Consequently, traders should avoid claiming more certainty than the available data support.
Can Liquidity Sweeps and Stop Hunts Be Backtested?
Yes, but the terminology must first be converted into objective rules.
A useful backtest needs answers to questions such as:
- What mathematically defines a swing high or low?
- How close must two highs be to count as equal highs?
- How far must price penetrate the level?
- Must the candle close back inside the range?
- How quickly must rejection occur?
- What constitutes displacement?
- What defines the subsequent market-structure break?
- Which trading sessions are included?
- How are spreads and transaction costs modelled?
Without objective definitions, traders can easily identify perfect sweeps retrospectively while overlooking failed examples.
How Liquidity Sweeps and Stop Hunts Fit Into a Trading Framework
A practical framework can reduce the concept to a sequence of decisions.
- Determine context: Identify higher-timeframe market structure.
- Locate liquidity: Mark only meaningful highs, lows and range boundaries.
- Wait: Allow price to reach the area rather than predicting that it must do so.
- Observe: Determine whether price accepts or rejects prices beyond the level.
- Confirm: Look for displacement or a meaningful structural shift.
- Define risk: Establish the invalidation point and position size before entry.
- Accept failure: Exit when the market invalidates the hypothesis.
This approach is compatible with broader technical analysis. NetBiz’s Forex Trading Strategy and EUR/USD guide provides additional context on combining technical analysis, market conditions and risk management into a structured trading process.
The Most Important Lesson About Stop Hunts
The most useful lesson is not that “institutions are hunting my stop.”
A more productive conclusion is that many traders observe the same technical levels and may place orders in similar locations.
When price reaches those locations, trading activity can increase substantially.
A trader who understands this can stop treating every breach of support or resistance as an automatic breakout or every reversal as manipulation.
Instead, the trader can observe how price behaves around the level and respond to evidence.
Conclusion: Trading Liquidity Sweeps and Stop Hunts Responsibly
Liquidity Sweeps and Stop Hunts provide a useful framework for examining why price often moves through obvious technical levels before reversing or continuing.
Previous highs, lows, equal highs, equal lows, range boundaries and session extremes can become important because traders frequently concentrate orders around visible reference points.
When price reaches these areas, stop-loss orders, breakout entries and other transactions can contribute to increased activity.
However, traders should distinguish a liquidity sweep from an allegation of deliberate manipulation. A chart can demonstrate that price moved through a level. It generally cannot establish which participant caused the move or whether retail stops were intentionally targeted.
The most effective use of liquidity analysis is therefore contextual. Higher-timeframe market structure identifies direction. Significant highs and lows identify potential liquidity. A sweep provides an event to observe. Rejection, displacement and structural change can provide additional confirmation. Risk management determines whether the resulting trade is acceptable.
Ultimately, successful trading does not require predicting every liquidity sweep. It requires recognising where liquidity may exist, understanding how price behaves when those areas are tested, distinguishing failed breakouts from genuine continuation and accepting that every setup remains probabilistic.
No responses yet