
In the dynamic world of cryptocurrency trading, understanding how to read and analyze charts is crucial. The ability to interpret these charts not only helps in making informed trading decisions but also enhances your overall trading strategy. Whether you are a novice or an experienced trader, mastering chart analysis can be your key to success in the volatile crypto market.
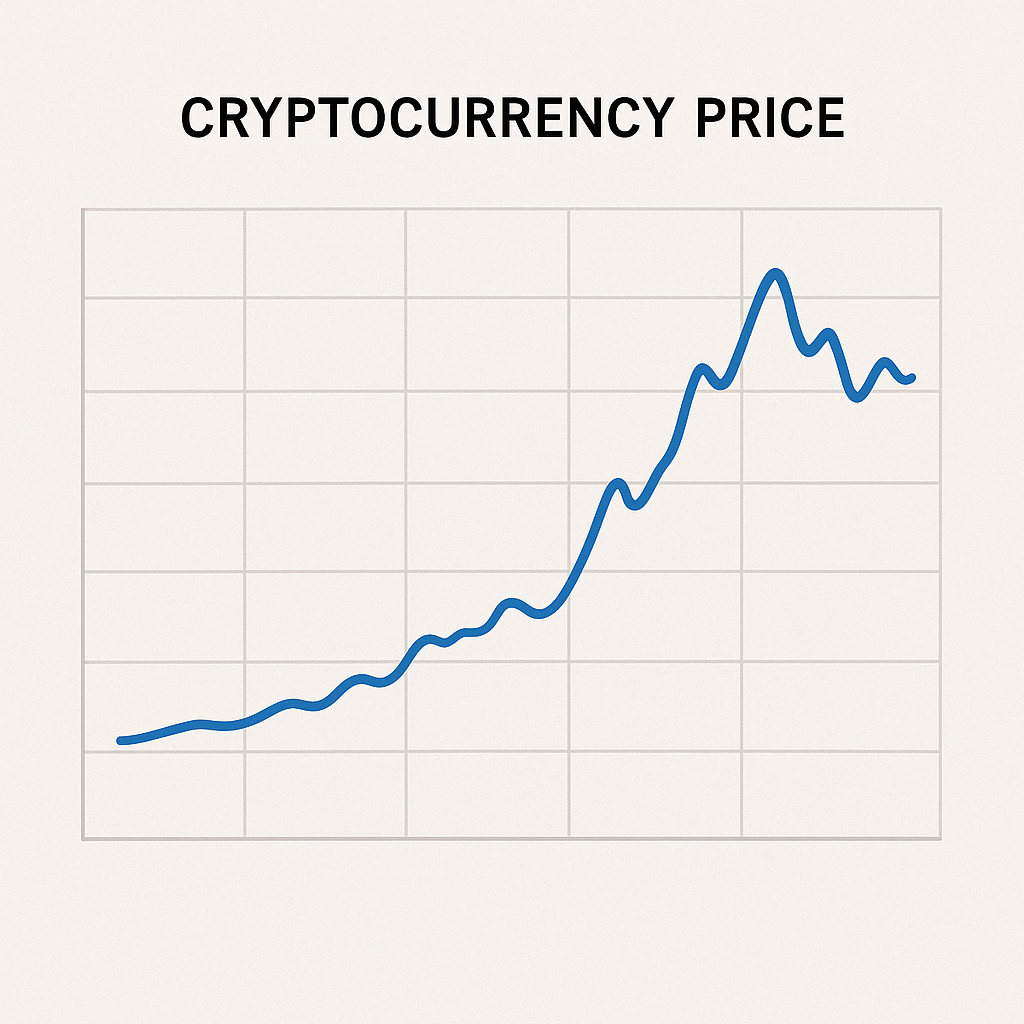
Crypto charts are graphical representations of the price movements of cryptocurrencies over a certain period. They help traders visualize data, identify trends, and make predictions about future price movements. The most commonly used types of charts in crypto trading are line charts, bar charts, and candlestick charts.
Crypto charts are not merely visual aids; they are indispensable tools in a trader’s toolkit. They transform numerical data into a visual format that is easier to interpret and analyze. By representing the historical performance of a cryptocurrency, charts allow traders to identify patterns and predict future price movements. This visual representation provides a comprehensive overview of how a particular asset has been performing over time, enabling traders to make data-driven decisions.
There are several types of crypto charts, each offering unique insights into market behavior. Line charts offer a simple, straightforward view of price trends, making them ideal for beginners. Bar charts provide a more detailed view by showing opening, closing, high, and low prices for each time period. Candlestick charts, however, are the most favored among traders due to their detailed depiction of market sentiment and price action. Each type of chart serves a specific purpose, and understanding how to use them effectively is essential for successful trading.
Selecting the appropriate chart depends on your trading goals and experience level. Beginners might start with line charts to grasp the basics of price movements. As you gain experience, you can transition to bar and candlestick charts for a more in-depth analysis. Experienced traders often use a combination of charts to gain a holistic view of the market. Understanding the strengths and limitations of each chart type will help you choose the right one for your trading strategy.
To effectively read crypto charts, you need to understand the key components involved in technical analysis. These components include support and resistance levels, trends, and indicators.
Support and resistance levels are fundamental concepts in technical analysis. Support refers to a price level where a downtrend can be expected to pause due to a concentration of demand. Resistance, on the other hand, is a price level where an uptrend can be expected to pause due to a concentration of supply.
Identifying support and resistance levels is crucial for making strategic trading decisions. These levels serve as psychological barriers where traders anticipate a pause or reversal in price movements. When a price approaches a support level, traders might anticipate a bounce upwards, providing a potential buying opportunity. Conversely, as a price nears a resistance level, traders might expect it to reverse downwards, indicating a potential selling point. Mastering these concepts can significantly enhance your trading strategy.
Trends are the general direction in which the price of a cryptocurrency is moving. There are three main types of trends: uptrends, downtrends, and sideways trends. Recognizing trends is crucial for developing a trading strategy, as it helps traders align their trades with the market direction.
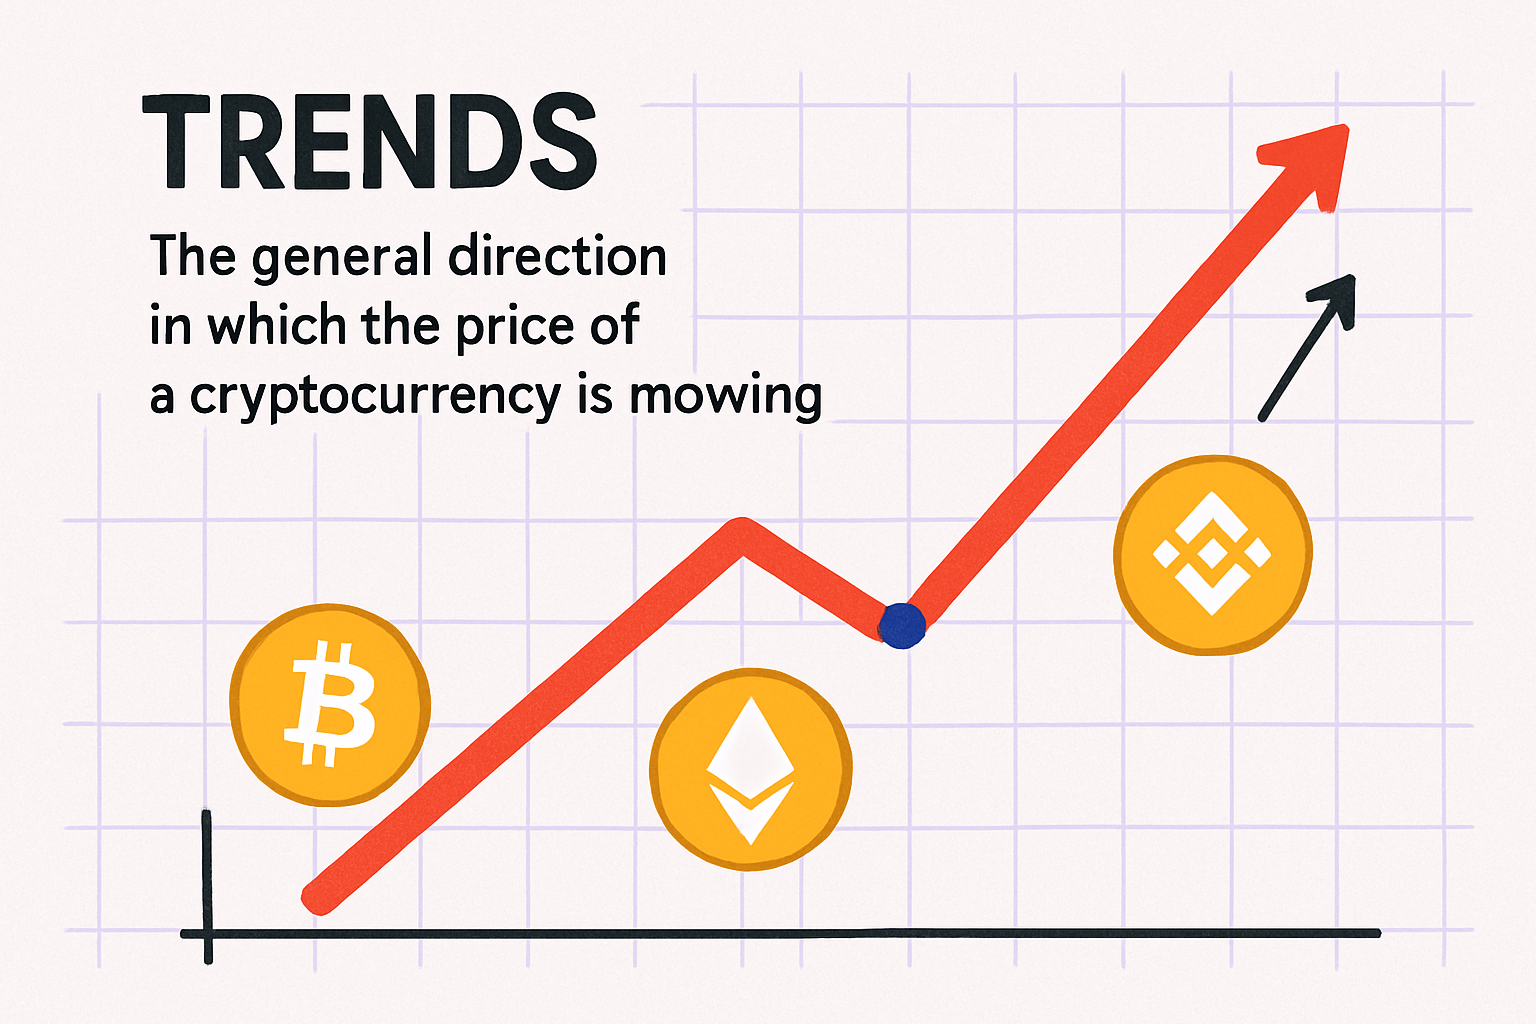
Uptrends indicate that the price is generally increasing over time, suggesting a buying opportunity. Downtrends, on the other hand, suggest a decrease in price, indicating a potential selling opportunity. Sideways trends, or ranging markets, occur when the price moves within a horizontal range, providing limited trading opportunities. Understanding these trends allows traders to align their strategies with the prevailing market conditions, maximizing their chances of success.
Indicators are mathematical calculations based on price and volume. They are used to predict future price movements and provide signals for buying or selling. Common indicators include Moving Averages, Relative Strength Index (RSI), and Bollinger Bands.
Each indicator serves a specific purpose and provides unique insights into market behavior. Moving averages smooth out price data, making it easier to identify trends. RSI helps identify overbought or oversold conditions, while Bollinger Bands measure market volatility. By combining multiple indicators, traders can develop a comprehensive trading strategy that considers various aspects of market behavior.
Technical analysis involves analyzing statistical trends gathered from trading activity, such as price movement and volume. Here’s how you can apply technical analysis for cryptocurrency trading:
Moving averages are used to smooth out price data by creating a constantly updated average price. They are particularly useful for identifying trends over specific periods. Simple Moving Average (SMA) and Exponential Moving Average (EMA) are the two most common types.
SMA calculates the average price over a specific period, providing a simple yet effective tool for trend identification. EMA, on the other hand, gives more weight to recent prices, making it more responsive to new information. Traders often use moving averages to identify trend reversals and generate buy or sell signals. By understanding how to leverage moving averages, you can enhance your ability to identify profitable trading opportunities.
RSI is a momentum oscillator that measures the speed and change of price movements. It ranges from 0 to 100 and is typically used to identify overbought or oversold conditions in a market. An RSI above 70 suggests that an asset may be overbought, while an RSI below 30 suggests it may be oversold.
Utilizing RSI allows traders to identify potential reversal points in the market. When an asset reaches overbought conditions, it may signal a forthcoming price drop, providing a selling opportunity. Conversely, oversold conditions might indicate an impending price increase, suggesting a buying opportunity. By incorporating RSI into your trading strategy, you can improve your ability to anticipate market movements and make informed trading decisions.
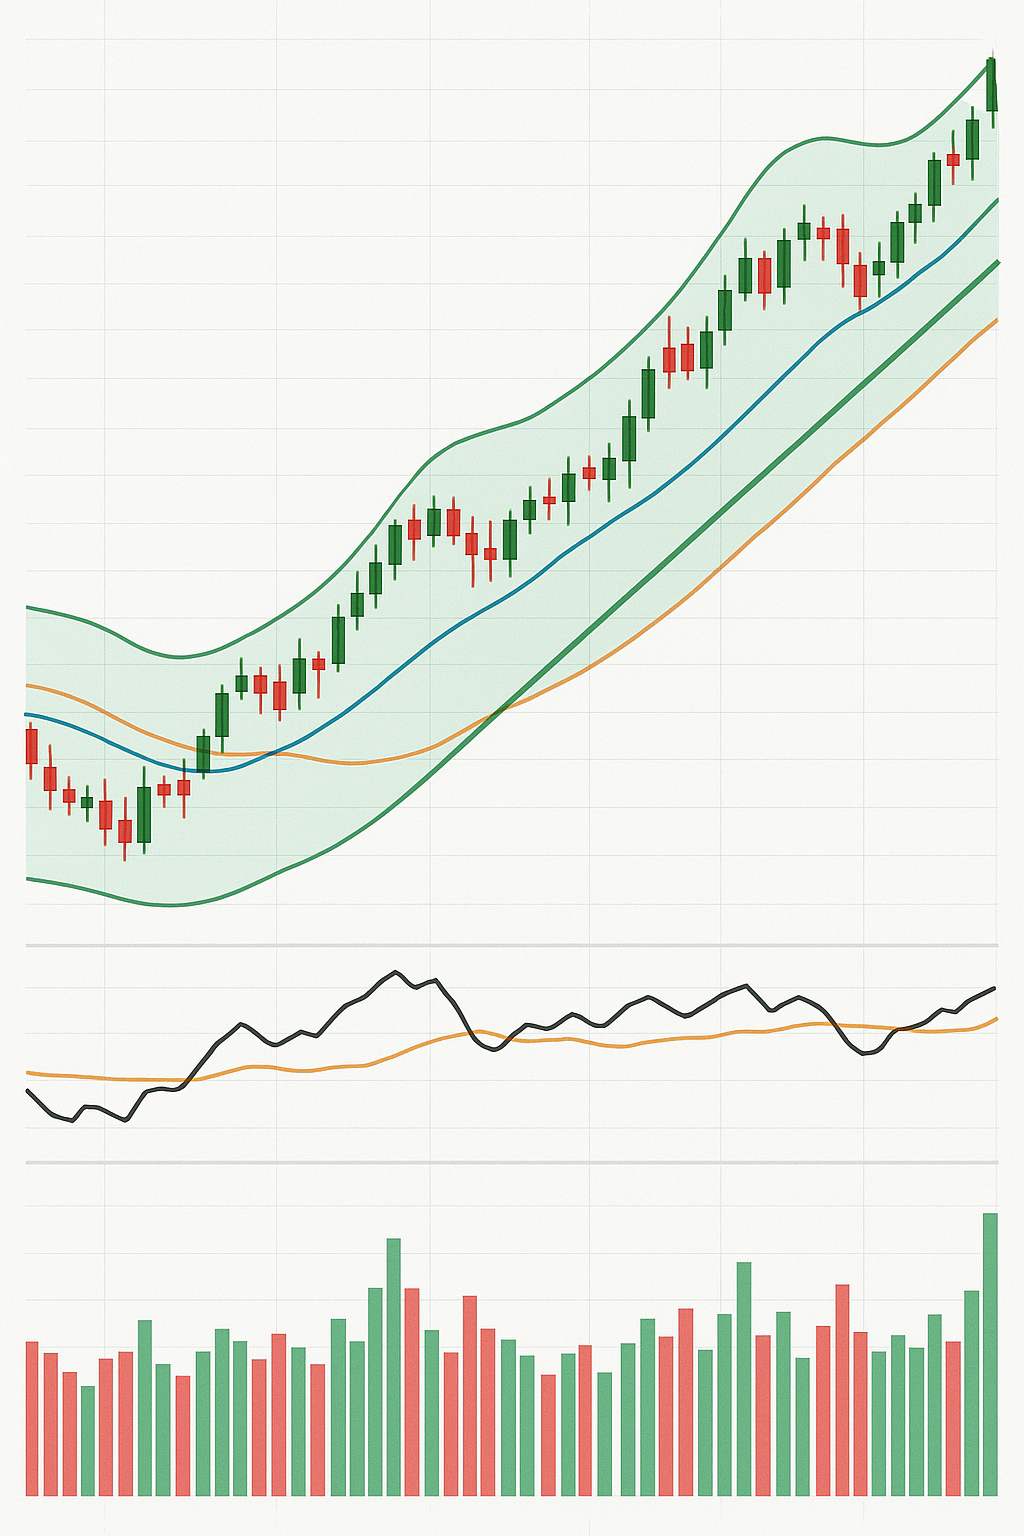
Bollinger Bands consist of a middle band (SMA) and two outer bands. These bands are used to measure market volatility. When the price moves closer to the upper band, the market may be overbought; when it moves closer to the lower band, the market may be oversold.
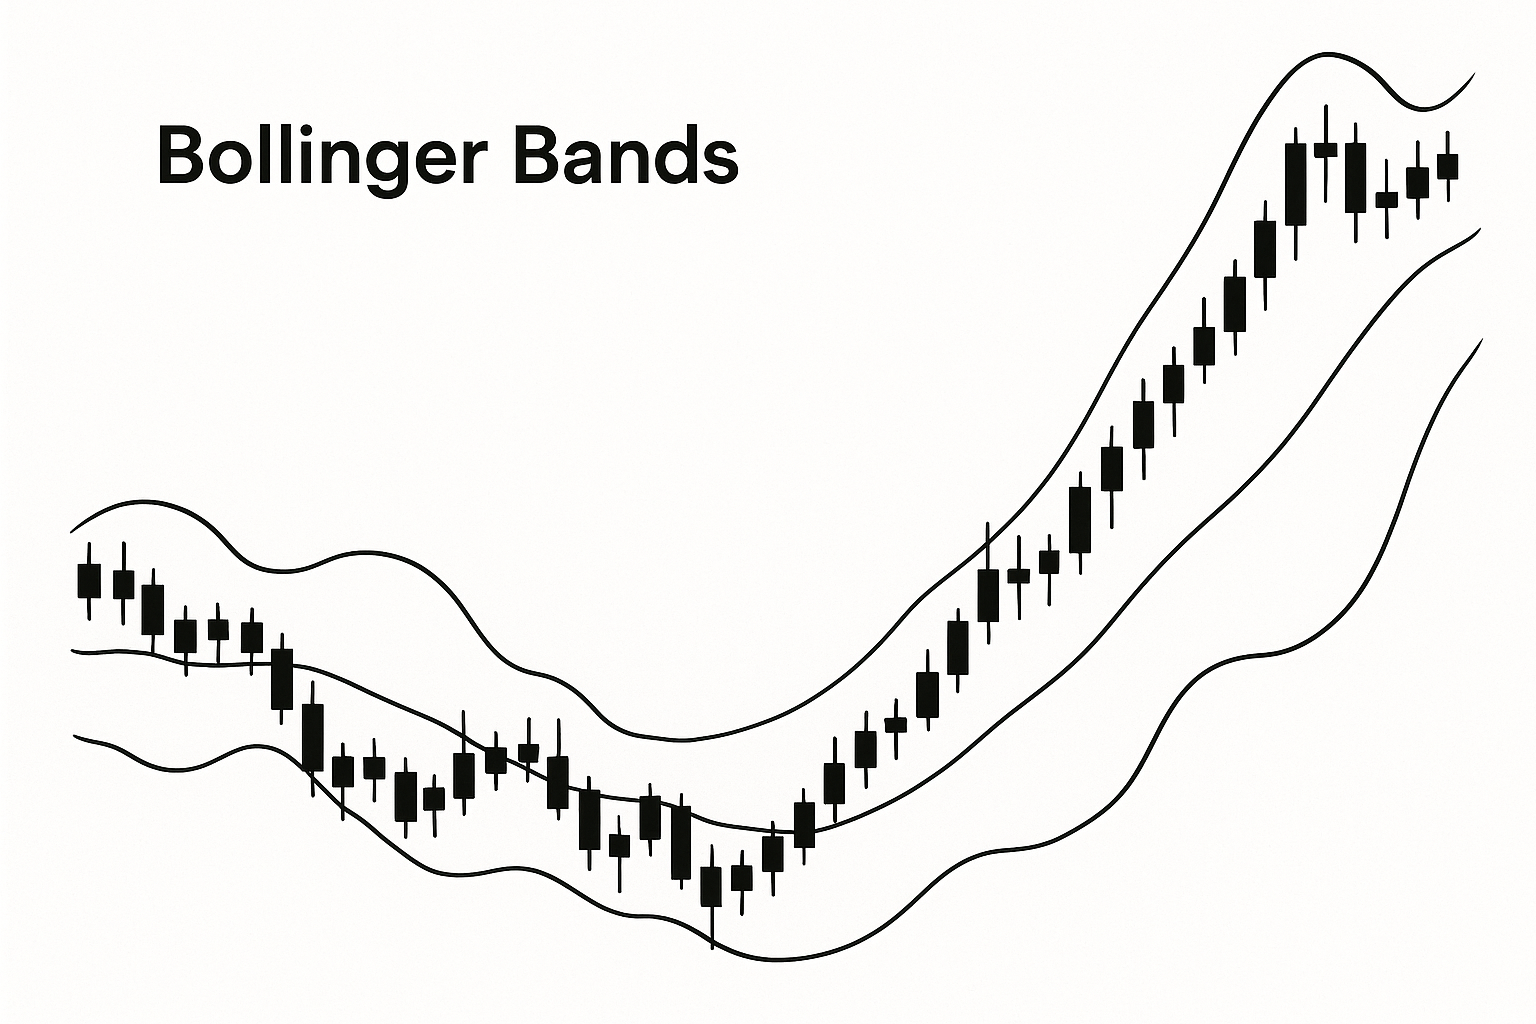
Bollinger Bands provide a visual representation of market volatility, allowing traders to identify potential breakout or reversal points. When the bands narrow, it indicates low volatility and a potential breakout. Conversely, when the bands widen, it suggests increased volatility and a possible trend continuation. Understanding how to interpret Bollinger Bands can help you make more informed trading decisions and optimize your trading strategy.
In live crypto trading, real-time chart analysis is essential. It allows traders to make quick decisions based on the latest market data. Here are some tips for effective live trading:
Constantly monitor market news and updates that could affect cryptocurrency prices. Use real-time charting tools that provide live data and alerts for significant price movements.
Staying informed is crucial for successful live trading. Market news, regulatory changes, and technological advancements can significantly impact cryptocurrency prices. By staying updated with the latest information, you can anticipate market movements and adjust your trading strategy accordingly. Utilize news aggregators and real-time alerts to ensure you never miss critical information that could influence your trades.
Implement risk management strategies to protect your investment. Set stop-loss orders to limit potential losses and use position sizing to manage the amount of capital at risk in each trade.

Risk management is a fundamental aspect of successful trading. By setting stop-loss orders, you can limit potential losses and protect your investment from unexpected market movements. Position sizing allows you to manage your capital effectively, ensuring that no single trade has the potential to significantly impact your overall portfolio. By implementing these strategies, you can minimize risk and enhance your long-term profitability.
Have a clear trading plan with defined entry and exit strategies. Stick to your plan and avoid emotional trading decisions.
A well-defined trading plan is essential for maintaining discipline and consistency in your trading activities. Your plan should outline your trading goals, entry and exit strategies, and risk management techniques. By adhering to your plan, you can avoid emotional decision-making and stick to a systematic approach to trading. Regularly review and adjust your plan to ensure it remains aligned with your trading objectives and market conditions.
Mastering chart analysis for crypto trading involves understanding the various types of charts, key components of technical analysis, and the application of indicators. By combining these elements with real-time data and disciplined trading strategies, you can enhance your ability to navigate the volatile crypto market successfully.
Learning to read crypto charts is a valuable skill that requires practice and experience. As you become more proficient in chart analysis, you will be better equipped to make informed trading decisions and achieve your financial goals in the world of cryptocurrency trading. Embrace the learning process, stay informed, and continuously refine your trading strategies to ensure long-term success in the ever-evolving crypto market.
No responses yet