Introduction
A number of variables, like market cycles, seasonal trends, and economic conditions, influence when to sell indices like the S&P 500. Selling decisions may be influenced by historical trends showing that certain months perform better or worse than others.
✔ Best Months for Selling:
- January, June, August, and September tend to be weaker months for the S&P 500, making them potential selling opportunities.
- September is historically one of the worst-performing months for stocks, often experiencing declines due to portfolio rebalancing and economic uncertainty.
✔ Best Days of the Week:
- Monday and Friday tend to be weaker trading days, while Tuesday has historically shown stronger performance.
✔ Market Cycles & Economic Indicators:
- Selling during economic downturns or interest rate hikes can be strategic if markets are expected to decline further.
- Watching earnings reports, Federal Reserve decisions, and inflation data can help determine optimal selling points.
✔ Technical Analysis & Trends:
- If the S&P 500 is approaching resistance levels or showing signs of reversal, it may be a good time to sell.
- Monitoring moving averages, RSI (Relative Strength Index), and MACD (Moving Average Convergence Divergence) can provide insights into market momentum.
Technical Indicators for Selling the S&P 500
1. Relative Strength Index (RSI)
The RSI measures momentum and helps identify overbought or oversold conditions. It ranges from 0 to 100, with readings above 70 indicating overbought conditions and below 30 signaling oversold conditions.
✔ Sell Signal:
- When RSI crosses above 70, it suggests the index is overbought and may experience a pullback.
- If RSI diverges downward while price continues rising, it indicates weakening momentum—a potential reversal.
✔ Example:
- In September 2022, the S&P 500 showed an RSI above 75, followed by a sharp correction in October.
2. Moving Averages (MA)
Moving averages smooth out price fluctuations and help identify trends. The most commonly used are: ✔ 50-day MA (short-term trend)
✔ 200-day MA (long-term trend)
✔ Sell Signal:
- When the 50-day MA crosses below the 200-day MA, it forms a Death Cross, signaling bearish momentum.
- If price fails to break above the 200-day MA, it suggests resistance and potential downside.
✔ Example:
- In March 2020, the S&P 500 formed a Death Cross, leading to a major sell-off during the COVID-19 crash.
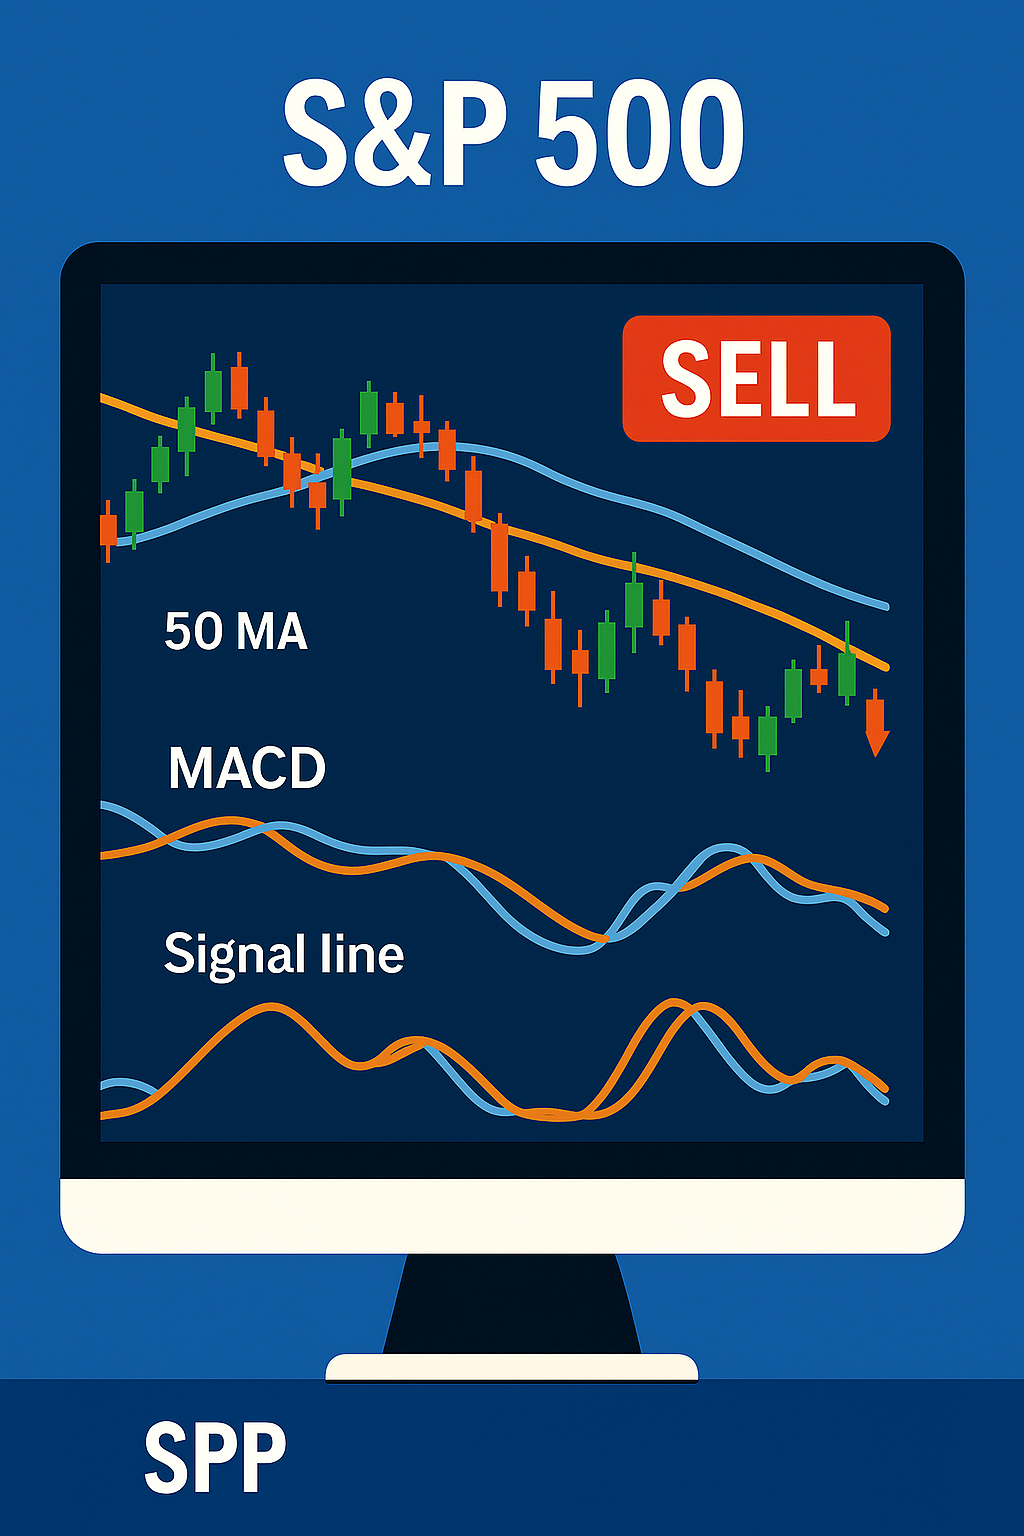
3. MACD (Moving Average Convergence Divergence)
The MACD tracks trend strength and reversals using two moving averages: ✔ MACD Line (short-term trend)
✔ Signal Line (long-term trend)
✔ Sell Signal:
- When the MACD Line crosses below the Signal Line, it suggests bearish momentum.
- If MACD diverges downward while price rises, it indicates weakening trend strength.
✔ Example:
- In December 2021, the MACD showed a bearish crossover, leading to a market decline in early 2022.
4. Stochastic Oscillator
The Stochastic Oscillator measures price momentum relative to recent highs/lows.
✔ Sell Signal:
- When the Stochastic Oscillator is above 80, it indicates overbought conditions.
- A bearish crossover (fast line crossing below slow line) suggests a reversal.
✔ Example:
- In August 2023, the S&P 500 showed a Stochastic reading above 85, followed by a correction in September.
5. Volume Analysis
Volume confirms price movements and helps assess market strength.
✔ Sell Signal:
- If price declines on high volume, it suggests strong bearish sentiment.
- If price rises on low volume, it indicates weak buying pressure—potential reversal.
✔ Example:
- In February 2024, the S&P 500 declined sharply on high volume, confirming a bearish trend.
Economic Events That Impact Selling Strategy
1. Federal Reserve Interest Rate Decisions
✔ Impact:
- Rate hikes increase borrowing costs, slowing economic growth and pressuring stock prices.
- Rate cuts boost liquidity, supporting stock market rallies.
✔ Sell Signal:
- If the Fed signals aggressive rate hikes, markets may decline.
- If inflation remains high despite rate hikes, stocks may struggle.
✔ Example:
- In 2022, the Fed raised rates aggressively, leading to a bear market in the S&P 500.
2. Inflation Reports (CPI & PPI)
✔ Impact:
- High inflation reduces consumer spending, pressuring corporate earnings.
- Low inflation supports economic growth, benefiting stocks.
✔ Sell Signal:
- If CPI (Consumer Price Index) rises above expectations, markets may decline.
- If PPI (Producer Price Index) shows rising costs, corporate margins may shrink.
✔ Example:
- In June 2022, CPI hit 9.1%, triggering a sharp sell-off in equities.
3. GDP Growth Reports
✔ Impact:
- Strong GDP growth supports stock market gains.
- Weak GDP growth signals economic slowdown, leading to sell-offs.
✔ Sell Signal:
- If GDP growth misses expectations, markets may decline.
- If GDP growth contracts, recession fears may trigger selling.
✔ Example:
- In Q1 2020, GDP contracted due to COVID-19, leading to a market crash.
4. Employment Data (Non-Farm Payrolls)
✔ Impact:
- Strong job growth supports consumer spending, benefiting stocks.
- Weak job growth signals economic weakness, pressuring markets.
✔ Sell Signal:
- If job growth slows, markets may decline.
- If unemployment rises, recession fears may increase.
✔ Example:
- In March 2020, unemployment spiked, triggering a market sell-off.
5. Earnings Season
✔ Impact:
- Strong earnings boost stock prices.
- Weak earnings lead to sell-offs.
✔ Sell Signal:
- If major companies miss earnings expectations, markets may decline.
- If earnings guidance is weak, stocks may struggle.
✔ Example:
- In Q3 2022, tech earnings disappointed, leading to a market correction.
Final Thoughts
Selling indices like the S&P 500 requires a combination of technical analysis and economic event monitoring. By tracking RSI, MACD, moving averages, and volume, alongside Fed decisions, inflation reports, and earnings, traders can optimize their exit strategies.
No responses yet