
In the fast-paced, often chaotic world of cryptocurrency trading, technical indicators are indispensable tools for navigating the market’s wild swings. Traders rely on a vast arsenal of tools, from moving averages to complex oscillators, to decipher price action and predict future movements. Yet, among these sophisticated instruments, one of the most foundational and powerful indicators is frequently misunderstood or overlooked: trading volume.
Volume is the market’s heartbeat. It is the engine that drives price trends, the fuel for breakouts, and the ultimate confirmation of market conviction. While price tells you what is happening, volume tells you how much force is behind the move. In a market as speculative and sentiment-driven as cryptocurrency, ignoring volume is like trying to navigate a storm without listening to the wind.
This guide provides a comprehensive exploration of volume analysis, tailored specifically for the unique dynamics of the crypto market. We will deconstruct the core principles of volume, explore advanced volume-based indicators, and delve into the crypto-native world of on-chain analysis to give you a complete toolkit for making more informed, confident, and profitable trading decisions.
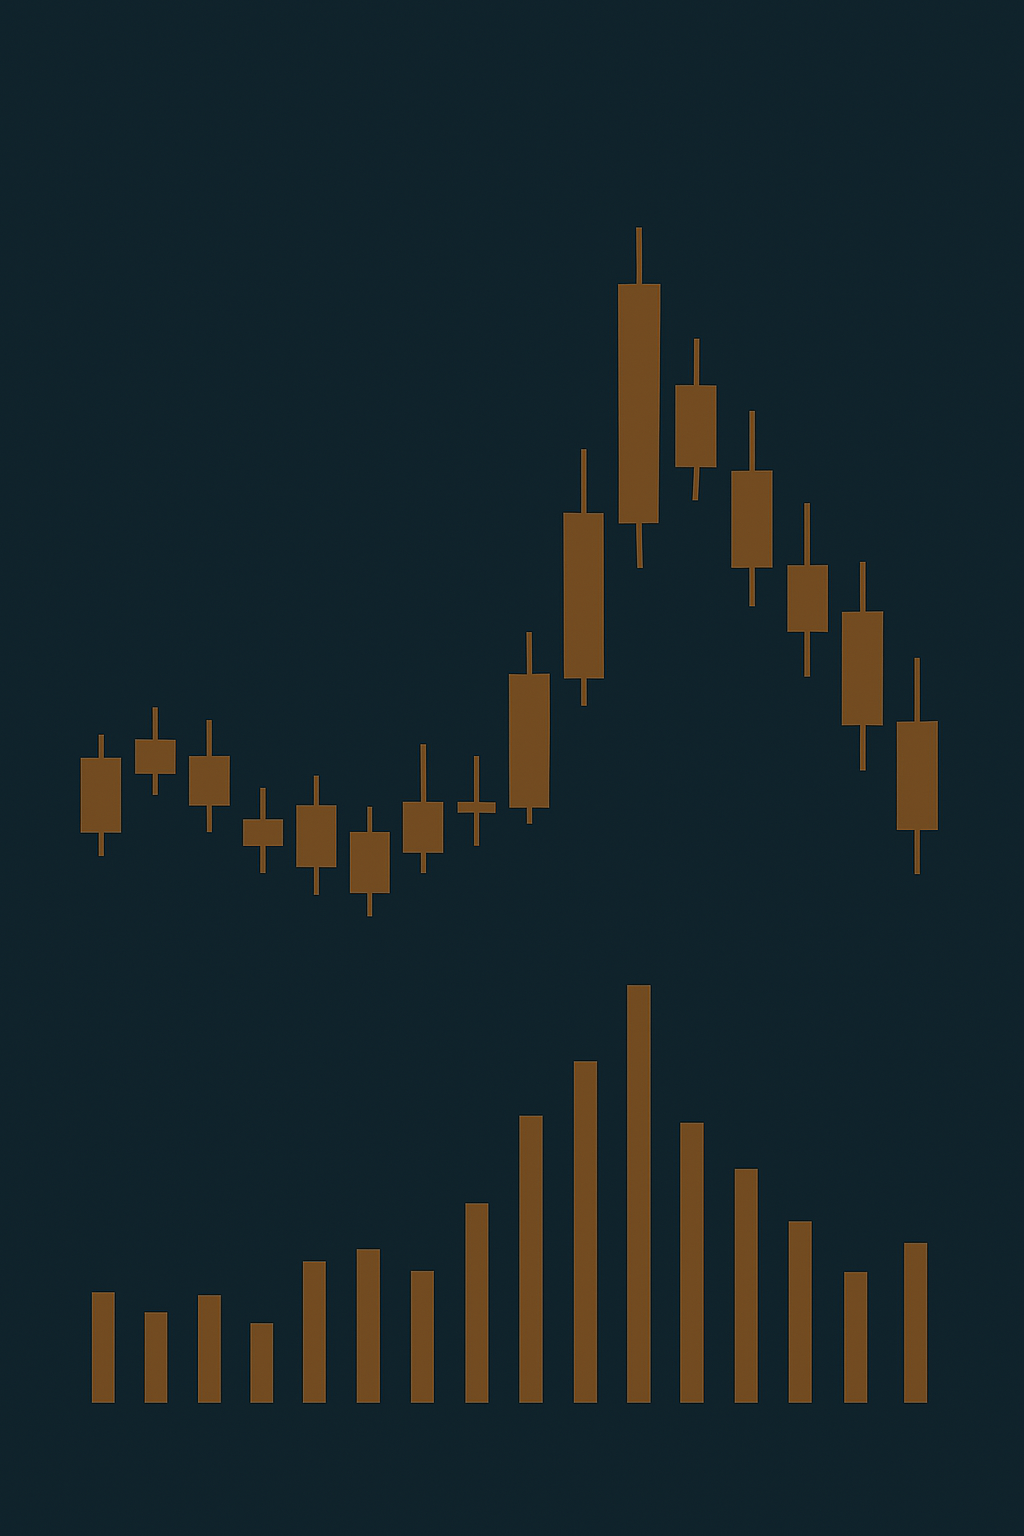
Caption: A typical crypto chart showing price candles with the corresponding volume bars at the bottom, a fundamental tool for any trader.
Section 1: The Fundamentals — What Is Trading Volume and Why Does It Matter?
At its most basic level, trading volume is the total amount of a specific cryptocurrency that has been bought and sold over a given period. This is typically displayed as a series of vertical bars at the bottom of a price chart, with each bar corresponding to a specific time frame (e.g., one hour, one day). Green bars usually indicate that the closing price was higher than the opening price for that period, while red bars indicate the opposite.
The importance of volume is directly tied to the concepts of liquidity and volatility:
- Liquidity: This refers to how active a market is. A market with high trading volume is considered highly liquid, meaning it’s easy to buy or sell large amounts of the asset without causing a significant price change. High liquidity is desirable as it leads to tighter bid-ask spreads and lower transaction costs.
- Volatility: This is the measure of how drastically an asset’s price changes. High liquidity generally leads to lower volatility, as a large number of buyers and sellers creates a more stable market. Conversely, low liquidity (low volume) often results in a more volatile market where a single large order can cause a dramatic price swing.
For a trader, volume is the ultimate confirmation tool. A price movement accompanied by high volume is considered more significant and sustainable than a move on low volume, which may indicate a lack of conviction or participation.
Section 2: The Core Principles of Volume Analysis
Reading volume is not about looking at a single bar in isolation; it’s about interpreting the relationship between price and volume over time. This relationship can reveal the underlying strength or weakness of a trend.
1. Convergence: When Price and Volume Agree
This is the normal, healthy state of a trend. Convergence confirms that the current price action is supported by market participation.
- Trend Confirmation (Uptrend): When the price is rising and the trading volume is also increasing, it signals strong buying interest and enthusiasm. This confirms the health of the uptrend and suggests it is likely to continue.
- Trend Confirmation (Downtrend): When the price is falling on high or increasing volume, it indicates significant selling pressure and fear. This confirms the strength of the downtrend.
2. Divergence: When Price and Volume Disagree
Divergence is a red flag. It occurs when price and volume move in opposite directions, signaling that the momentum behind the current trend is weakening and a potential reversal may be on the horizon.
- Bearish Divergence (Weakening Uptrend): If the price is making new highs but the trading volume is decreasing, it suggests that fewer participants are willing to buy at these elevated prices. This lack of interest is a warning sign that the uptrend is losing steam and could soon reverse.
- Bullish Divergence (Weakening Downtrend): If the price is making new lows but the trading volume is decreasing, it indicates that selling pressure is drying up. Fewer sellers are willing to part with their assets at these low prices, which can precede a bottoming out and a potential bullish reversal.
3. Volume Spikes: Signaling Exhaustion and Reversals
A sudden, dramatic spike in volume after a prolonged trend can often signal a climax, known as an exhaustion move.
- Climax Top: After a long uptrend, a sharp price increase accompanied by a massive volume spike can indicate that the last wave of buyers (often retail investors driven by FOMO) has entered the market. This “buying climax” often exhausts the buying pressure, leading to a sharp reversal as smart money begins to sell.
- Capitulation Bottom: After a steep downtrend, a final wave of panic selling, marked by a huge volume spike, can signal that sellers are exhausted. This “capitulation” often marks the bottom of the trend, as there are few sellers left and buyers can begin to take control at low prices.
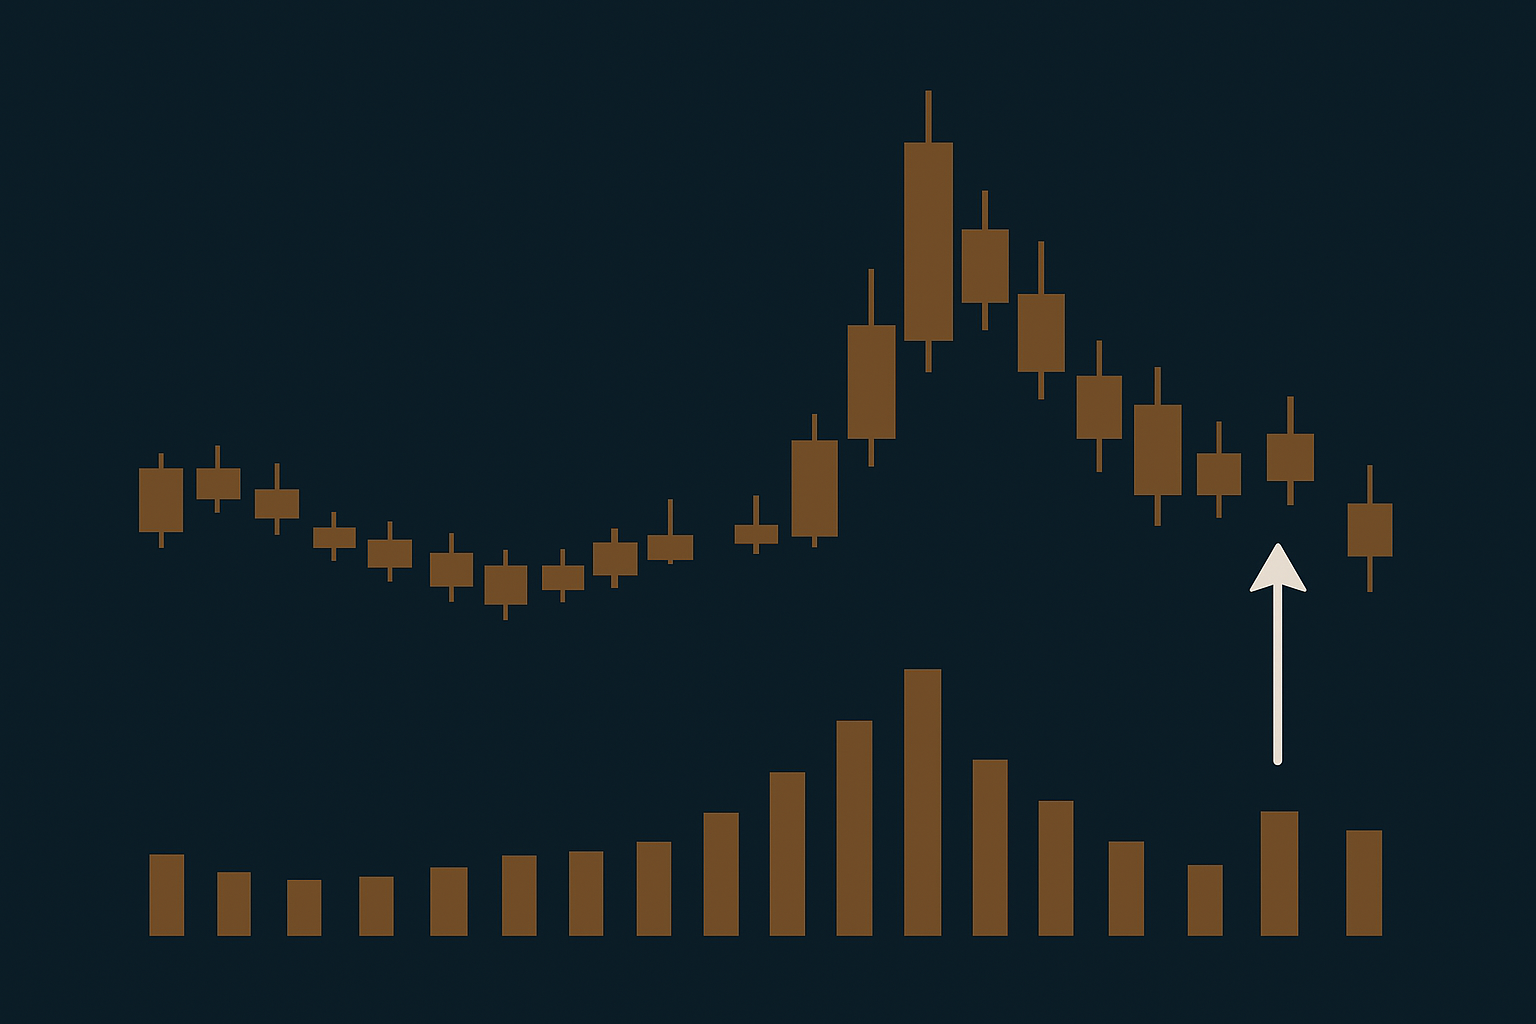
Caption: An example of a volume spike on a chart, often indicating a key turning point in the market.
Section 3: Advanced Volume Indicators — Beyond the Basic Bars
While the standard volume bars are essential, more advanced indicators can provide deeper insights by combining price and volume data in sophisticated ways.
On-Balance Volume (OBV)
The OBV is a cumulative momentum indicator that uses volume flow to predict price changes. It operates on a simple premise:
- If the price closes higher than the previous day, the day’s volume is added to the OBV total.
- If the price closes lower, the day’s volume is subtracted.
A rising OBV line indicates that volume on up-days is outpacing volume on down-days, confirming buying pressure and a bullish trend. A falling OBV confirms a bearish trend. Divergences between price and the OBV are particularly powerful signals of a potential trend reversal.
Accumulation/Distribution (A/D) Line
The A/D line is another cumulative indicator that assesses whether an asset is being “accumulated” (bought) or “distributed” (sold). Unlike the OBV, which only considers the closing price, the A/D line factors in where the price closes relative to its high-low range for the period.
- If a crypto closes near its high for the day, the A/D line rises, indicating accumulation.
- If it closes near its low, the A/D line falls, indicating distribution.
When the A/D line is rising while the price is falling, it signals a bullish divergence, suggesting underlying buying pressure. Conversely, if the price is rising but the A/D line is falling, it’s a bearish divergence, warning that distribution may be occurring under the surface.
Volume Profile: The Trader’s X-Ray
Volume Profile is one of the most powerful advanced tools available. Instead of showing volume over time (like the bars at the bottom of a chart), it displays volume at specific price levels, plotted as a horizontal histogram on the side of the chart. This provides an x-ray view of the market, revealing where the most significant trading activity has occurred.
Key components of the Volume Profile include:
- Point of Control (POC): The single price level with the highest traded volume. This is the “fairest” price where buyers and sellers have agreed the most, and it often acts as a powerful magnet for price or a strong support/resistance level.
- Value Area (VA): The price range where a specific percentage (typically 70%) of the total volume was traded. This is considered the “fair value” zone for the asset. Trading outside the VA is seen as a potential breakout.
- High Volume Nodes (HVNs): These are peaks in the volume profile, representing areas of high liquidity and price consolidation. HVNs act as strong support and resistance zones because a large number of positions were initiated there.
- Low Volume Nodes (LVNs): These are valleys in the profile, representing price levels with very little trading activity. Prices tend to move quickly through LVNs, as there is little support or resistance to stop them. These are often seen as “air pockets” in the market and can signal breakout zones.
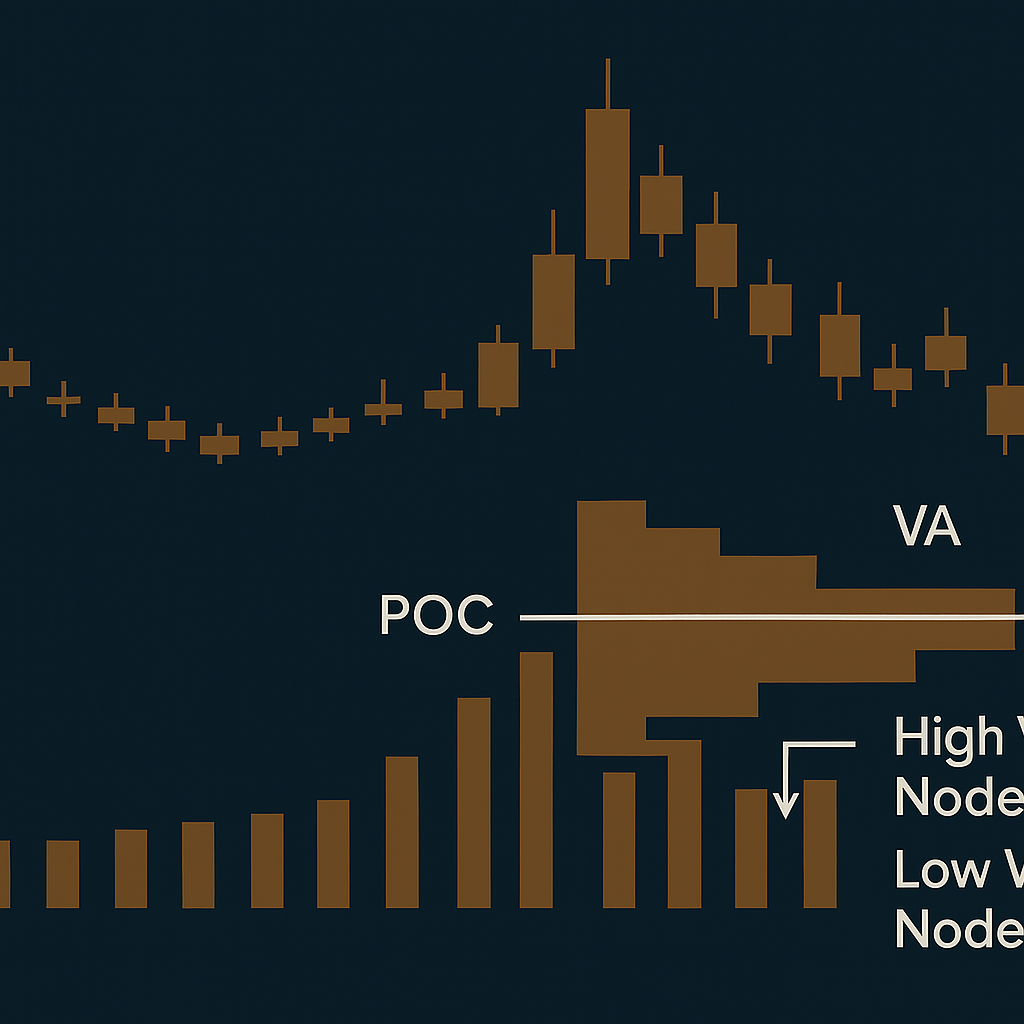
Caption: A chart with the Volume Profile indicator applied, showing the Point of Control (POC), Value Area (VA), and High/Low Volume Nodes.
Section 4: The Crypto Edge — On-Chain Volume Analysis
One of the unique advantages of cryptocurrency trading is the ability to conduct on-chain analysis. Because public blockchains are transparent ledgers, anyone can analyze the actual flow of funds on the network, providing insights that are simply unavailable in traditional markets like stocks or forex.
On-Chain Volume vs. Exchange Trading Volume
It’s crucial to understand the difference between these two metrics:
- Exchange Trading Volume: This is the volume reported by exchanges like Coinbase or Binance. It reflects all buying and selling activity on that platform, much of which occurs on internal ledgers and is not immediately recorded on the blockchain. This data can be susceptible to manipulation, such as wash trading, where an entity simultaneously buys and sells an asset to artificially inflate volume.
- On-Chain Volume: This measures the total value of transactions recorded directly on the blockchain itself. It represents genuine economic activity and network usage, such as transfers between wallets or interactions with smart contracts.
While exchange volume is useful for gauging short-term liquidity and sentiment, on-chain volume provides a more transparent and reliable measure of a network’s health and adoption.
Key On-Chain Volume Metrics for Traders
Platforms like Glassnode and Nansen provide dashboards that make on-chain data accessible. Key metrics to watch include:
- Exchange Inflows and Outflows: A large volume of a specific crypto (e.g., Bitcoin) moving onto exchanges can be a bearish signal, suggesting that large holders (“whales”) are preparing to sell. Conversely, large outflows from exchanges to private wallets can be bullish, indicating a desire to hold for the long term.
- Whale Wallet Movements: Tracking the volume moved by large, known wallets can provide clues about the intentions of major market players. A whale moving a large volume of tokens to an exchange could precede a significant sell-off.
- Miner Activity: Monitoring the volume of coins being sent from miners’ wallets to exchanges can indicate their sentiment. If miners are selling large volumes, it could suggest they believe the price is at a local top.
Section 5: Practical Application and Common Pitfalls
Confirming Breakouts with Volume
One of the most powerful uses of volume analysis is to confirm price breakouts from chart patterns (e.g., triangles, flags) or key support/resistance levels.
- A True Breakout: A genuine breakout should be accompanied by a significant spike in volume, ideally at least 50% above the recent average. This high volume confirms strong conviction from market participants and increases the likelihood that the breakout will be sustained.
- A False Breakout (Fakeout): If a price breaks a key level but the volume is low or declining, it’s a major red flag. This suggests a lack of participation and a high probability that the price will quickly reverse back into its previous range.
Common Mistakes to Avoid
- Analyzing Volume in Isolation: Volume is a confirmation tool, not a standalone trading system. A volume signal should always be interpreted in the context of price action and other indicators.
- Ignoring Relative Context: Volume is relative. A “high” volume day during a bull market might be an average day during a market crash. Always compare the current volume to its recent historical average (e.g., the 20-day moving average of volume) to gauge its significance.
- Falling for Fake Volume: Be aware that wash trading is prevalent on some unregulated exchanges to create a false impression of liquidity. It’s often wise to focus on volume data from reputable, high-liquidity exchanges.
Conclusion: Listening to the Market’s Story
In the complex and often unpredictable cryptocurrency market, volume analysis provides an invaluable layer of clarity. It is the narrative that accompanies the price chart, revealing the conviction, enthusiasm, and fear of market participants.
By mastering the ability to read basic volume bars, applying advanced indicators like the Volume Profile and OBV, and leveraging the unique insights of on-chain data, you can move beyond simply reacting to price and begin to understand the forces that drive it. Volume analysis will not give you a crystal ball, but it will give you a powerful edge—the ability to listen to the market’s true story and trade not just what you see, but what you understand.
For further learning, explore these resources:
- TradingView:https://www.tradingview.com/
- Investopedia – Technical Analysis:https://www.investopedia.com/technical-analysis-4689657
Sources and related content
Technical Analysis of Stocks and Trends Definition – Investopedia
investopedia.com/terms/t/technical-analysis-of-stocks-and-trends.asp
Technical Analysis for Stocks: Beginners Overview – Investopedia
investopedia.com/articles/active-trading/102914/technical-analysis-strategies-beginners.asp
Technical Analysis 101 | Best Volume Indicators for Trading
No responses yet